今天就跟大家聊聊有关Python如何实现多项式回归,可能很多人都不太了解,为了让大家更加了解,小编给大家总结了以下内容,希望大家根据这篇文章可以有所收获。
python可以做什么
Python是一种编程语言,内置了许多有效的工具,Python几乎无所不能,该语言通俗易懂、容易入门、功能强大,在许多领域中都有广泛的应用,例如最热门的大数据分析,人工智能,Web开发等。
1、概述
1.1 有监督学习

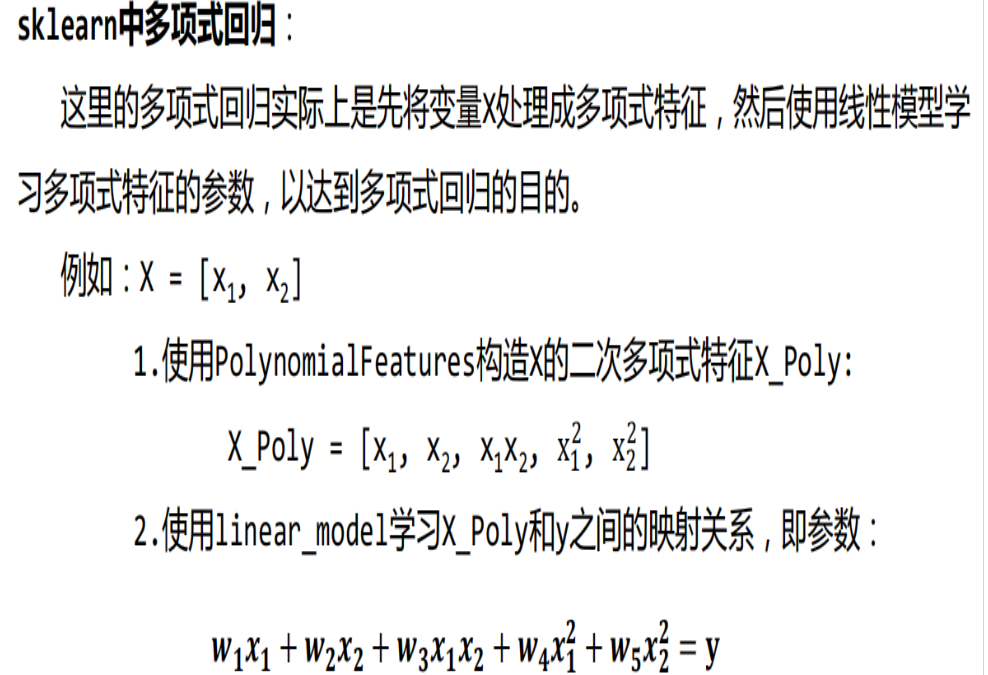
1.2 多项式回归
上一次我们讲解了线性回归,这次我们重点分析多项式回归。
多项式回归(Polynomial Regression) 是研究一个因变量与一 个或多个自变量间多项式的回归分析方法。如果自变量只有一个 时,称为一元多项式回归;如果自变量有多个时,称为多元多项 式回归。

(1)在一元回归分析中,如果依变量 y 与自变量 x 的关系为非线性的,但 是又找不到适当的函数曲线来拟合,则可以采用一元多项式回归。
(2)多项式回归的最大优点就是可以通过增加 x 的高次项对实测点进行逼 近,直至满意为止。
(3)事实上,多项式回归可以处理相当一类非线性问题,它在回归分析 中占有重要的地位,因为任一函数都可以分段用多项式来逼近。
2 概念
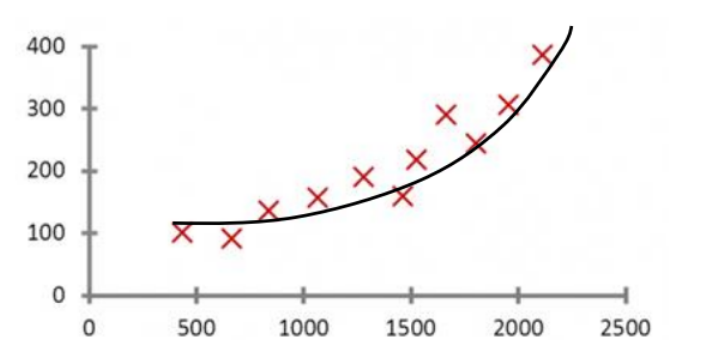
之前提到的线性回归实例中,是运用直线来拟合数据输入与输出之间的线性关系。不同于线性回归, 多项式回归是使用曲线拟合数据的输入与输出的映射关系 。
3 案例实现——方法1
3.1 案例分析
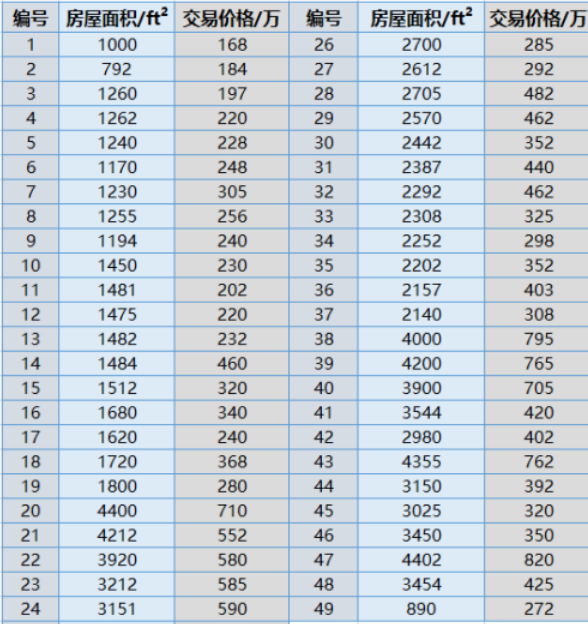
应用背景:我们在前面已经根据已知的房屋成交价和房屋的尺寸进行了线性回归,继而可以对已知房屋尺寸,而未知房屋成交价格的实例进行了成交价格的预测,但是在实际的应用中这样的拟合往往不够好,因此我们在此对该数据集进行多项式回归。
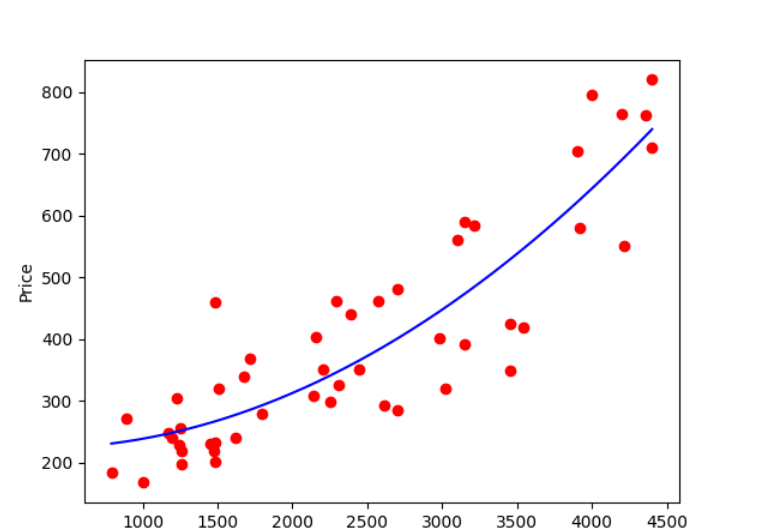
目标:对房屋成交信息建立多项式回归方程,并依据回归方程对房屋价格进行预测。
成交信息包括房屋的面积以及对应的成交价格:
(1)房屋面积单位为平方英尺( ft 2 )
(2)房屋成交价格单位为万
3.2 代码实现
import matplotlib.pyplot as pltimport numpy as npfrom sklearn import linear_modelfrom sklearn.preprocessing import PolynomialFeatures # 读取数据集datasets_X = []datasets_Y = []fr = open('多项式线性回归.csv','r')lines = fr.readlines()for line in lines: items = line.strip().split(',') datasets_X.append(int(items[0])) datasets_Y.append(int(items[1])) length = len(datasets_X)datasets_X = np.array(datasets_X).reshape([length,1])datasets_Y = np.array(datasets_Y) minX = min(datasets_X)maxX = max(datasets_X)X = np.arange(minX,maxX).reshape([-1,1]) poly_reg = PolynomialFeatures(degree = 2) #degree=2表示建立datasets_X的二次多项式特征X_poly。X_poly = poly_reg.fit_transform(datasets_X) #使用PolynomialFeatures构造x的二次多项式X_polylin_reg_2 = linear_model.LinearRegression()lin_reg_2.fit(X_poly, datasets_Y) #然后创建线性回归,使用线性模型(linear_model)学习X_poly和y之间的映射关系 print(X_poly)print(lin_reg_2.predict(poly_reg.fit_transform(X)))print('Coefficients:', lin_reg_2.coef_) #查看回归方程系数(k)print('intercept:', lin_reg_2.intercept_) ##查看回归方程截距(b)print('the model is y={0}+({1}*x)+({2}*x^2)'.format(lin_reg_2.intercept_,lin_reg_2.coef_[0],lin_reg_2.coef_[1]))# 图像中显示plt.scatter(datasets_X, datasets_Y, color = 'red') #scatter函数用于绘制数据点,这里表示用红色绘制数据点;#plot函数用来绘制回归线,同样这里需要先将X处理成多项式特征;plt.plot(X, lin_reg_2.predict(poly_reg.fit_transform(X)), color = 'blue')plt.xlabel('Area')plt.ylabel('Price')plt.show()3.3 结果
[[1.0000000e+00 1.0000000e+03 1.0000000e+06]
[1.0000000e+00 7.9200000e+02 6.2726400e+05]
[1.0000000e+00 1.2600000e+03 1.5876000e+06]
[1.0000000e+00 1.2620000e+03 1.5926440e+06]
[1.0000000e+00 1.2400000e+03 1.5376000e+06]
[1.0000000e+00 1.1700000e+03 1.3689000e+06]
[1.0000000e+00 1.2300000e+03 1.5129000e+06]
[1.0000000e+00 1.2550000e+03 1.5750250e+06]
[1.0000000e+00 1.1940000e+03 1.4256360e+06]
[1.0000000e+00 1.4500000e+03 2.1025000e+06]
[1.0000000e+00 1.4810000e+03 2.1933610e+06]
[1.0000000e+00 1.4750000e+03 2.1756250e+06]
[1.0000000e+00 1.4820000e+03 2.1963240e+06]
[1.0000000e+00 1.4840000e+03 2.2022560e+06]
[1.0000000e+00 1.5120000e+03 2.2861440e+06]
[1.0000000e+00 1.6800000e+03 2.8224000e+06]
[1.0000000e+00 1.6200000e+03 2.6244000e+06]
[1.0000000e+00 1.7200000e+03 2.9584000e+06]
[1.0000000e+00 1.8000000e+03 3.2400000e+06]
[1.0000000e+00 4.4000000e+03 1.9360000e+07]
[1.0000000e+00 4.2120000e+03 1.7740944e+07]
[1.0000000e+00 3.9200000e+03 1.5366400e+07]
[1.0000000e+00 3.2120000e+03 1.0316944e+07]
[1.0000000e+00 3.1510000e+03 9.9288010e+06]
[1.0000000e+00 3.1000000e+03 9.6100000e+06]
[1.0000000e+00 2.7000000e+03 7.2900000e+06]
[1.0000000e+00 2.6120000e+03 6.8225440e+06]
[1.0000000e+00 2.7050000e+03 7.3170250e+06]
[1.0000000e+00 2.5700000e+03 6.6049000e+06]
[1.0000000e+00 2.4420000e+03 5.9633640e+06]
[1.0000000e+00 2.3870000e+03 5.6977690e+06]
[1.0000000e+00 2.2920000e+03 5.2532640e+06]
[1.0000000e+00 2.3080000e+03 5.3268640e+06]
[1.0000000e+00 2.2520000e+03 5.0715040e+06]
[1.0000000e+00 2.2020000e+03 4.8488040e+06]
[1.0000000e+00 2.1570000e+03 4.6526490e+06]
[1.0000000e+00 2.1400000e+03 4.5796000e+06]
[1.0000000e+00 4.0000000e+03 1.6000000e+07]
[1.0000000e+00 4.2000000e+03 1.7640000e+07]
[1.0000000e+00 3.9000000e+03 1.5210000e+07]
[1.0000000e+00 3.5440000e+03 1.2559936e+07]
[1.0000000e+00 2.9800000e+03 8.8804000e+06]
[1.0000000e+00 4.3550000e+03 1.8966025e+07]
[1.0000000e+00 3.1500000e+03 9.9225000e+06]
[1.0000000e+00 3.0250000e+03 9.1506250e+06]
[1.0000000e+00 3.4500000e+03 1.1902500e+07]
[1.0000000e+00 4.4020000e+03 1.9377604e+07]
[1.0000000e+00 3.4540000e+03 1.1930116e+07]
[1.0000000e+00 8.9000000e+02 7.9210000e+05]]
[231.16788093 231.19868474 231.22954958 ... 739.2018995 739.45285011
739.70386176]
Coefficients: [ 0.00000000e+00 -1.75650177e-02 3.05166076e-05]
intercept: 225.93740561055927
the model is y=225.93740561055927+(0.0*x)+(-0.017565017675036532*x^2)
3.4 可视化
4 案例实现方法2
4.1 代码
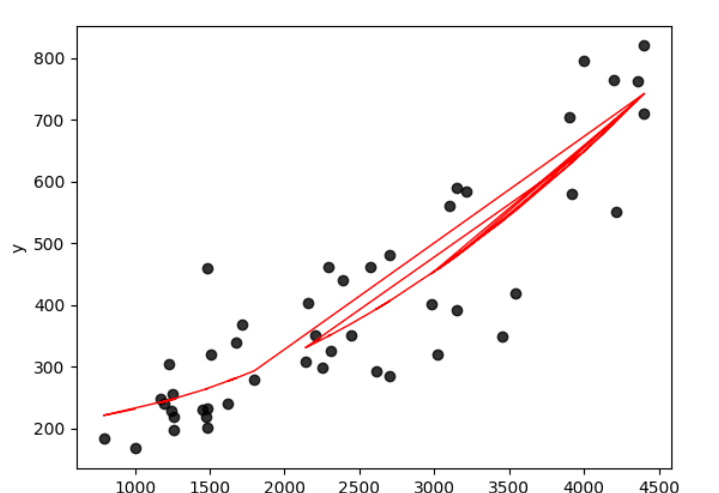
import matplotlib.pyplot as pltfrom sklearn.preprocessing import PolynomialFeaturesfrom sklearn.pipeline import Pipelinefrom sklearn.linear_model import LinearRegressionfrom sklearn.metrics import mean_squared_error, r2_scoreimport numpy as npimport pandas as pdimport warnings warnings.filterwarnings(action="ignore", module="sklearn") dataset = pd.read_csv('多项式线性回归.csv')X = np.asarray(dataset.get('x'))y = np.asarray(dataset.get('y')) # 划分训练集和测试集X_train = X[:-2]X_test = X[-2:]y_train = y[:-2]y_test = y[-2:] # fit_intercept 为 Truemodel1 = Pipeline([('poly', PolynomialFeatures(degree=2)), ('linear', LinearRegression(fit_intercept=True))])model1 = model1.fit(X_train[:, np.newaxis], y_train)y_test_pred1 = model1.named_steps['linear'].intercept_ + model1.named_steps['linear'].coef_[1] * X_testprint('while fit_intercept is True:................')print('Coefficients: ', model1.named_steps['linear'].coef_)print('Intercept:', model1.named_steps['linear'].intercept_)print('the model is: y = ', model1.named_steps['linear'].intercept_, ' + ', model1.named_steps['linear'].coef_[1], '* X')# 均方误差print("Mean squared error: %.2f" % mean_squared_error(y_test, y_test_pred1))# r2 score,0,1之间,越接近1说明模型越好,越接近0说明模型越差print('Variance score: %.2f' % r2_score(y_test, y_test_pred1), '\n') # fit_intercept 为 Falsemodel2 = Pipeline([('poly', PolynomialFeatures(degree=2)), ('linear', LinearRegression(fit_intercept=False))])model2 = model2.fit(X_train[:, np.newaxis], y_train)y_test_pred2 = model2.named_steps['linear'].coef_[0] + model2.named_steps['linear'].coef_[1] * X_test + \ model2.named_steps['linear'].coef_[2] * X_test * X_testprint('while fit_intercept is False:..........................................')print('Coefficients: ', model2.named_steps['linear'].coef_)print('Intercept:', model2.named_steps['linear'].intercept_)print('the model is: y = ', model2.named_steps['linear'].coef_[0], '+', model2.named_steps['linear'].coef_[1], '* X + ', model2.named_steps['linear'].coef_[2], '* X^2')# 均方误差print("Mean squared error: %.2f" % mean_squared_error(y_test, y_test_pred2))# r2 score,0,1之间,越接近1说明模型越好,越接近0说明模型越差print('Variance score: %.2f' % r2_score(y_test, y_test_pred2), '\n') plt.xlabel('x')plt.ylabel('y')# 画训练集的散点图plt.scatter(X_train, y_train, alpha=0.8, color='black')# 画模型plt.plot(X_train, model2.named_steps['linear'].coef_[0] + model2.named_steps['linear'].coef_[1] * X_train + model2.named_steps['linear'].coef_[2] * X_train * X_train, color='red', linewidth=1)plt.show()4.2 结果
如果不用框架,需要自己手动对数据添加高阶项,有了框架就方便多了。sklearn 使用 Pipeline 函数简化这部分预处理过程。
当 PolynomialFeatures 中的degree=1时,效果和使用 LinearRegression 相同,得到的是一个线性模型,degree=2时,是二次方程,如果是单变量的就是抛物线,双变量的就是抛物面。以此类推。
这里有一个 fit_intercept 参数,下面通过一个例子看一下它的作用。
当 fit_intercept 为 True 时,coef_ 中的第一个值为 0,intercept_ 中的值为实际的截距。
当fit_intercept 为 False 时,coef_ 中的第一个值为截距,intercept_ 中的值为 0。
如图,第一部分是 fit_intercept 为 True 时的结果,第二部分是 fit_intercept 为 False 时的结果。
while fit_intercept is True:................Coefficients: [ 0.00000000e+00 -3.70858180e-04 2.78609637e-05]Intercept: 204.25470490804574the model is: y = 204.25470490804574 + -0.00037085818009180454 * XMean squared error: 26964.95Variance score: -3.61 while fit_intercept is False:..........................................Coefficients: [ 2.04254705e+02 -3.70858180e-04 2.78609637e-05]Intercept: 0.0the model is: y = 204.2547049080572 + -0.0003708581801012066 * X + 2.7860963722809286e-05 * X^2Mean squared error: 7147.78Variance score: -0.224.3 可视化
看完上述内容,你们对Python如何实现多项式回归有进一步的了解吗?如果还想了解更多知识或者相关内容,请关注编程网行业资讯频道,感谢大家的支持。


