本文小编为大家详细介绍“怎么用Pyecharts绘制常用的图形”,内容详细,步骤清晰,细节处理妥当,希望这篇“怎么用Pyecharts绘制常用的图形”文章能帮助大家解决疑惑,下面跟着小编的思路慢慢深入,一起来学习新知识吧。
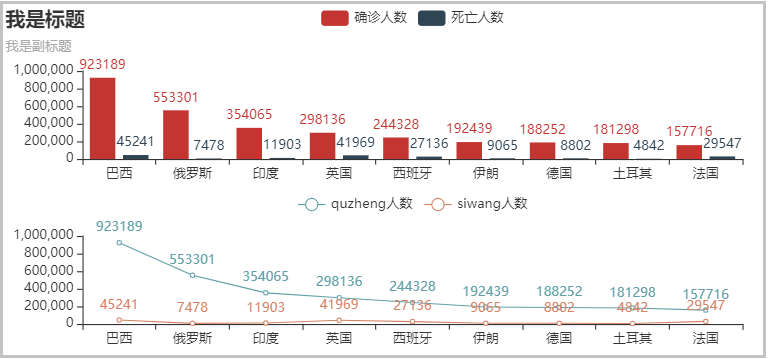
1.上下组合
from pyecharts.charts import Bar, Line, Gridfrom pyecharts import options# 1、准备数据country = ['巴西', '俄罗斯', '印度', '英国', '西班牙', '伊朗', '德国', '土耳其', '法国']quezheng = [923189,553301,354065,298136,244328,192439,188252,181298,157716]siwang = [45241,7478,11903,41969,27136,9065,8802,4842,29547]# 2、绘制柱形图bar = ( Bar() .add_xaxis(country) .add_yaxis("确诊人数", quezheng) .add_yaxis("死亡人数", siwang) .set_global_opts(title_opts=options.TitleOpts(title="我是标题", subtitle="我是副标题")))# 3、绘制线图line = ( Line() .add_xaxis(country) .add_yaxis("quzheng人数", quezheng) .add_yaxis("siwang人数", siwang) .set_global_opts(legend_opts=opts.LegendOpts(pos_bottom="45%")))# 4、创建组合图(Grid(init_opts=opts.InitOpts(width='750px', height='350px')) .add(bar,grid_opts=opts.GridOpts(pos_bottom="60%")) .add(line,grid_opts=opts.GridOpts(pos_top="60%"))).render_notebook()结果如下:

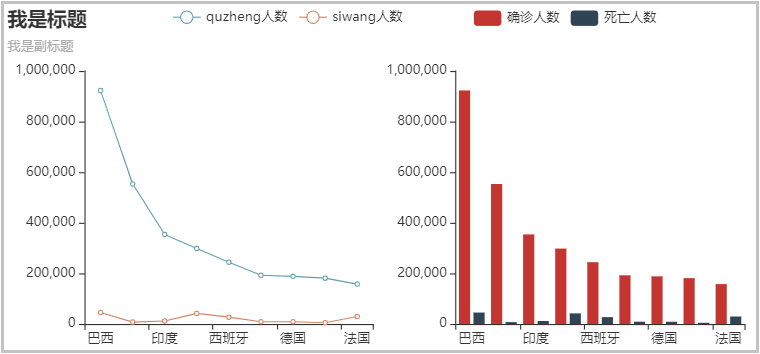
2.左右组合
from pyecharts.charts import Bar, Line, Gridfrom pyecharts import options# 1、准备数据country = ['巴西', '俄罗斯', '印度', '英国', '西班牙', '伊朗', '德国', '土耳其', '法国']quezheng = [923189,553301,354065,298136,244328,192439,188252,181298,157716]siwang = [45241,7478,11903,41969,27136,9065,8802,4842,29547]# 2、绘制柱形图bar = ( Bar() .add_xaxis(country) .add_yaxis("确诊人数", quezheng, label_opts=opts.LabelOpts(is_show=False)) .add_yaxis("死亡人数", siwang, label_opts=opts.LabelOpts(is_show=False)) .set_global_opts(title_opts=options.TitleOpts(title="我是标题", subtitle="我是副标题"), legend_opts=opts.LegendOpts(pos_right="20%")))# 3、绘制线图line = ( Line() .add_xaxis(country) .add_yaxis("quzheng人数", quezheng, label_opts=opts.LabelOpts(is_show=False)) .add_yaxis("siwang人数", siwang, label_opts=opts.LabelOpts(is_show=False)) .set_global_opts(legend_opts=opts.LegendOpts(pos_left="20%")))# 4、创建组合图(Grid(init_opts=opts.InitOpts(width='750px', height='350px')) .add(bar,grid_opts=opts.GridOpts(pos_left="55%")) .add(line,grid_opts=opts.GridOpts(pos_right="55%"))).render_notebook()结果如下:

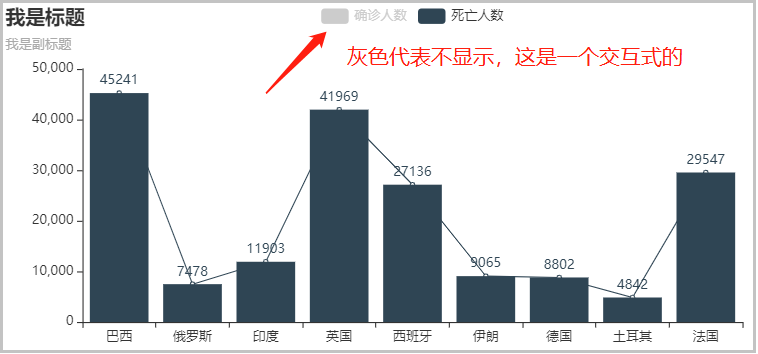
3.一轴多图
from pyecharts.charts import Bar, Line, Gridfrom pyecharts import options# 1、准备数据from pyecharts.charts import Bar, Line, Gridfrom pyecharts import options# 1、准备数据country = ['巴西', '俄罗斯', '印度', '英国', '西班牙', '伊朗', '德国', '土耳其', '法国']quezheng = [923189,553301,354065,298136,244328,192439,188252,181298,157716]siwang = [45241,7478,11903,41969,27136,9065,8802,4842,29547]# 2、绘制柱形图bar = ( Bar(init_opts=opts.InitOpts(width='750px', height='350px')) .add_xaxis(country) .add_yaxis("确诊人数", quezheng) .add_yaxis("死亡人数", siwang) .set_global_opts(title_opts=options.TitleOpts(title="我是标题", subtitle="我是副标题")))# 3、绘制线图line = ( Line() .add_xaxis(country) .add_yaxis("确诊人数", quezheng, label_opts=opts.LabelOpts(is_show=False)) .add_yaxis("死亡人数", siwang, label_opts=opts.LabelOpts(is_show=False)))# 4、创建组合图bar.overlap(line).render_notebook()结果如下:

读到这里,这篇“怎么用Pyecharts绘制常用的图形”文章已经介绍完毕,想要掌握这篇文章的知识点还需要大家自己动手实践使用过才能领会,如果想了解更多相关内容的文章,欢迎关注编程网行业资讯频道。


