这篇文章将为大家详细讲解有关Prometheus与Grafana如何集成,小编觉得挺实用的,因此分享给大家做个参考,希望大家阅读完这篇文章后可以有所收获。
简介
Grafana 是一个可视化仪表盘,它拥有美观的图标和布局展示,功能齐全的仪表盘和图形编辑器,默认支持 CloudWatch、Graphite、Elasticsearch、InfluxDB、Mysql、PostgreSQL、Prometheus、OpenTSDB 等作为数据源。
安装 Grafana
通过docker容器安装Grafana
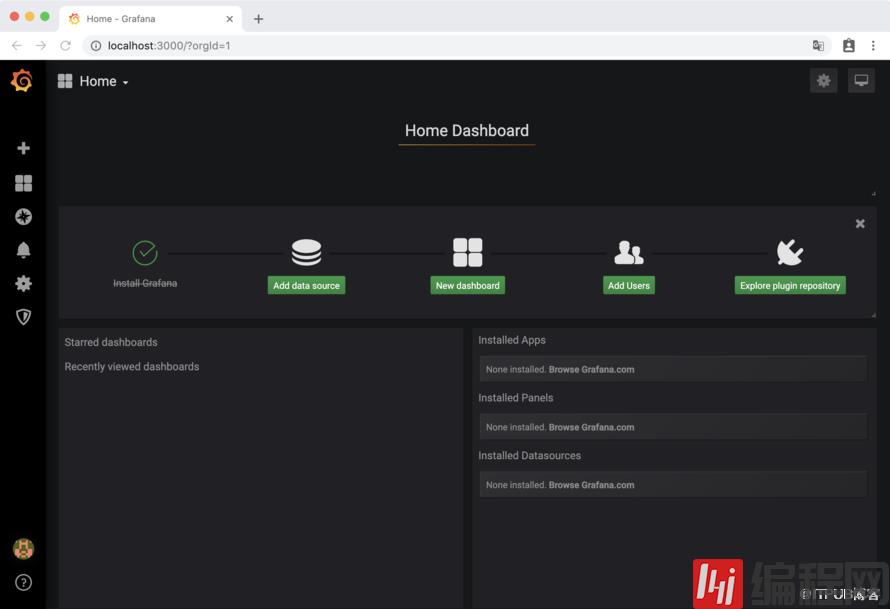
docker run -d --name=grafana -p 3000:3000 grafana/grafana访问 http://localhost:3000/ 账号 admin 密码 admin ,登录后界面如下:
添加Prometheus数据源
点击 “Add data soure” 选择 “Prometheus” 出现添加界面:
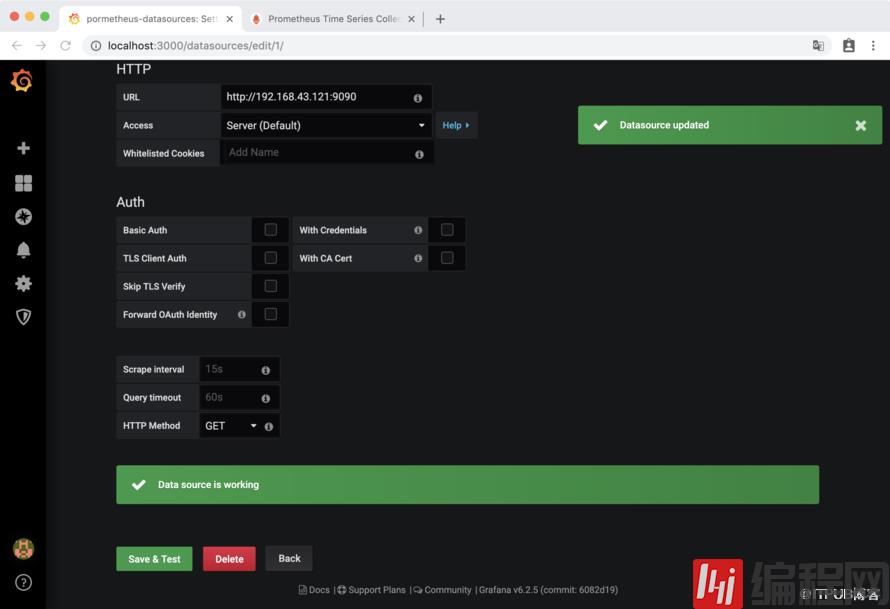
然后填写 Name : prometheus-datasources , URL : prometheus server 地址 , 其他配置缺省即可,然后保存。
配置
创建一个Dashboard
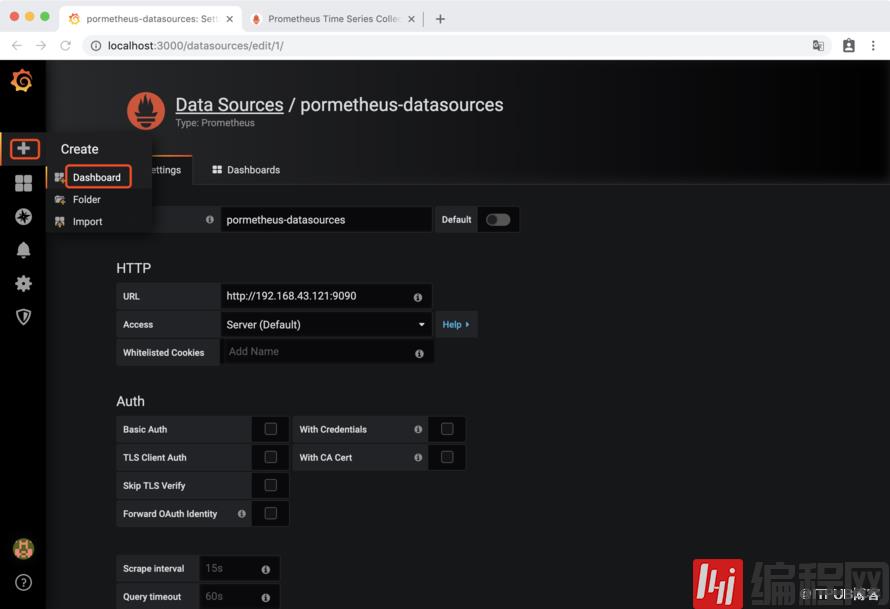
点击 “+” 图标创建一个Dashbaord
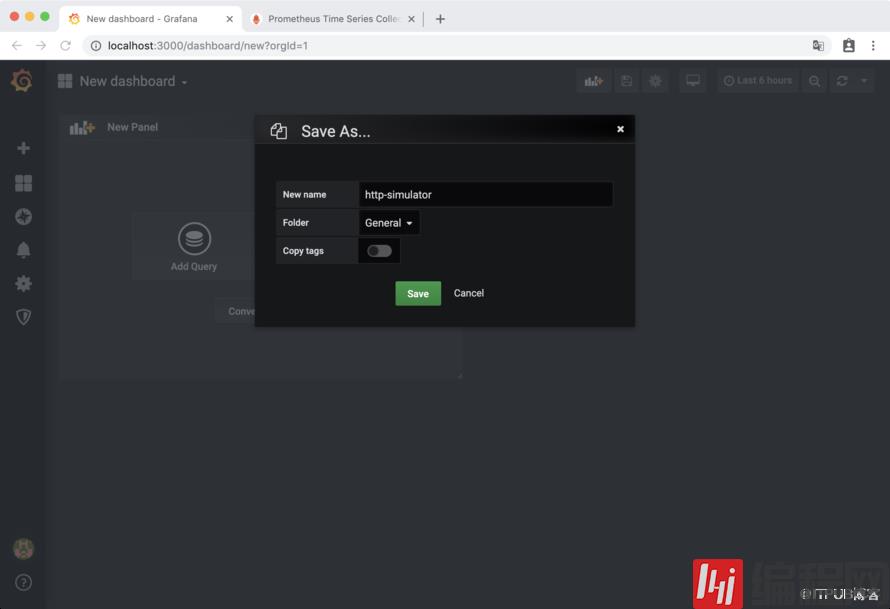
点击 “保存” 图标保存Dashboard,使用缺省Folder,给Dashboard起名为 “http-simulator”
展示请求率
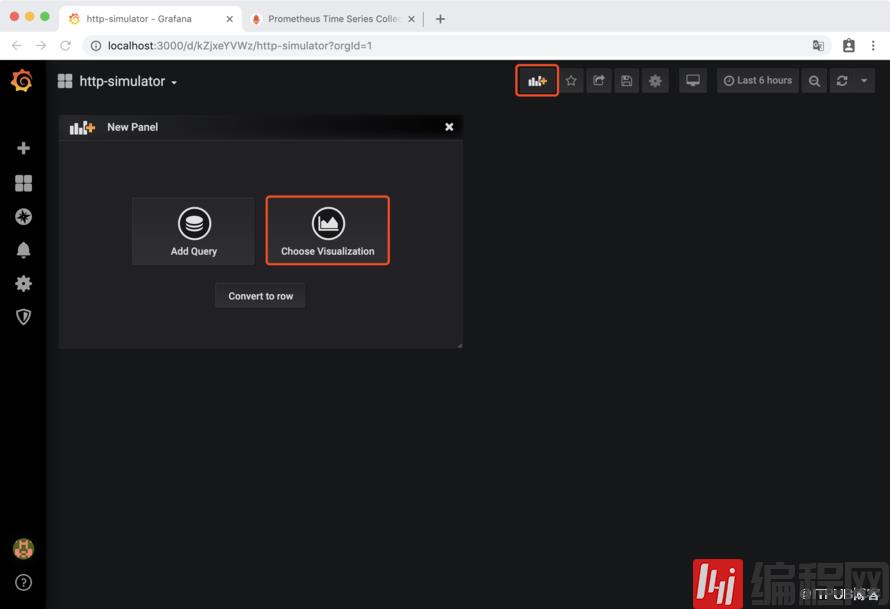
点击 “Add panel” 图标,点击 “Choose Visualization” 选择可视化 图表的类型。
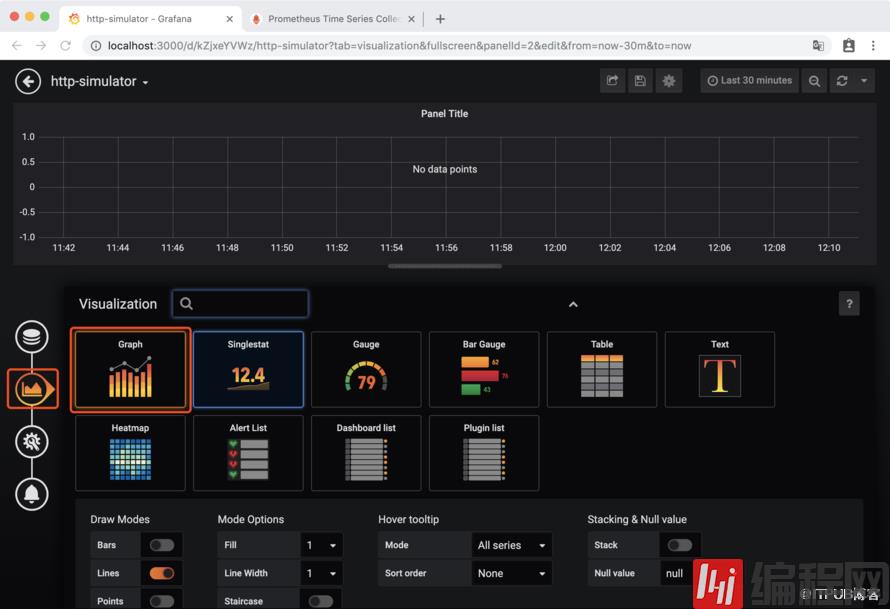
点击 “Visualization” 选择 “Graph”
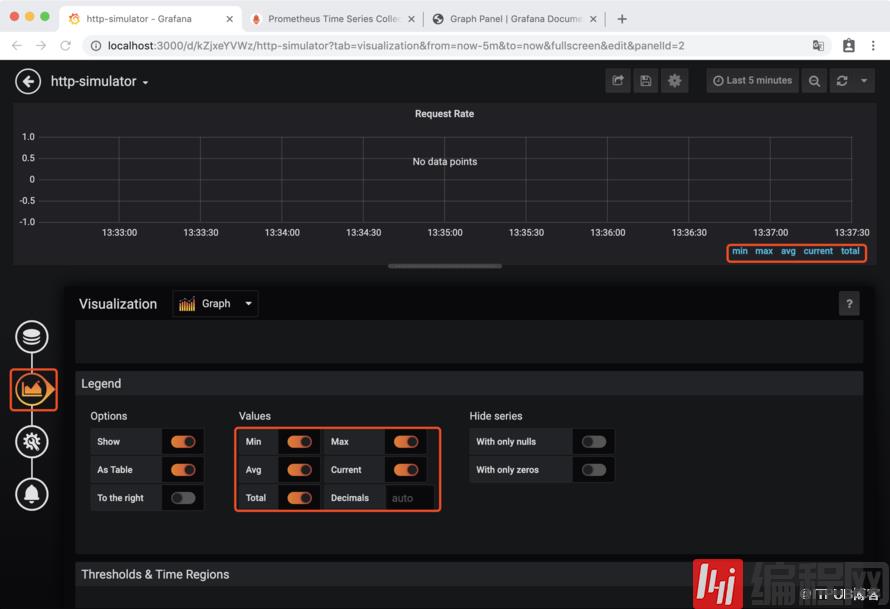
调整 “Legend” 显示度量标准查询返回的所有值的 最小值、最大值、平均值、当前值、总计
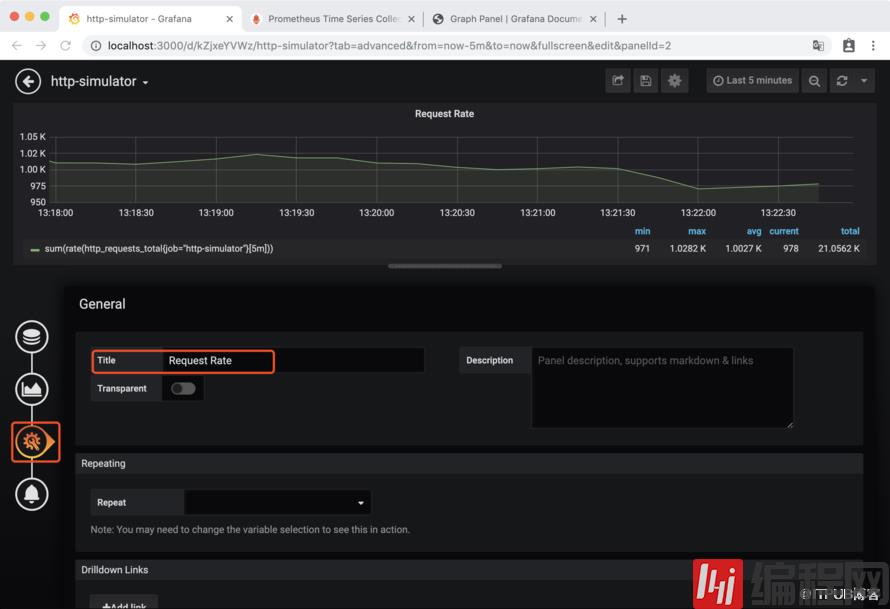
点击 “General” 修改 “Title” 为 “Request Rate” ,
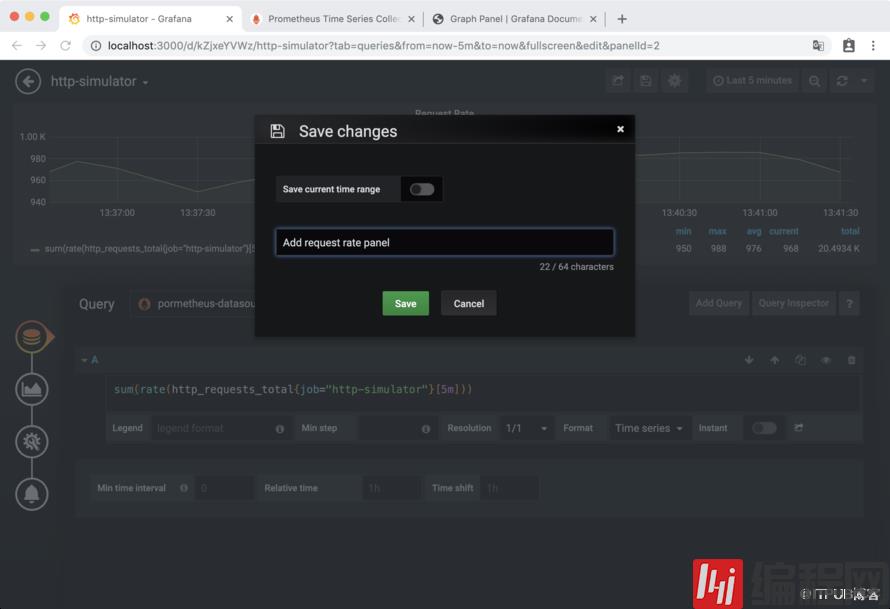
点击 “Queries” 输入 Prometheus 表达式
sum(rate(http_requests_total{job="http-simulator"}[5m]))
可看到已经展示出了请求率变化曲线图,也显示了最小值、最大值、平均值、当前值、总计。
点击右上方的 “保存” 图标,保存对 Dahsboard 的修改。
展示实时错误率
为了展示数据明显,把 http-simulator 服务的错误率改到40%
curl -H 'Content-Type: application/json' -X PUT -d '{"error_rate": 1}' http://127.0.0.1:8080/error_rate有了上面配置经验,这里就不说的太细了。
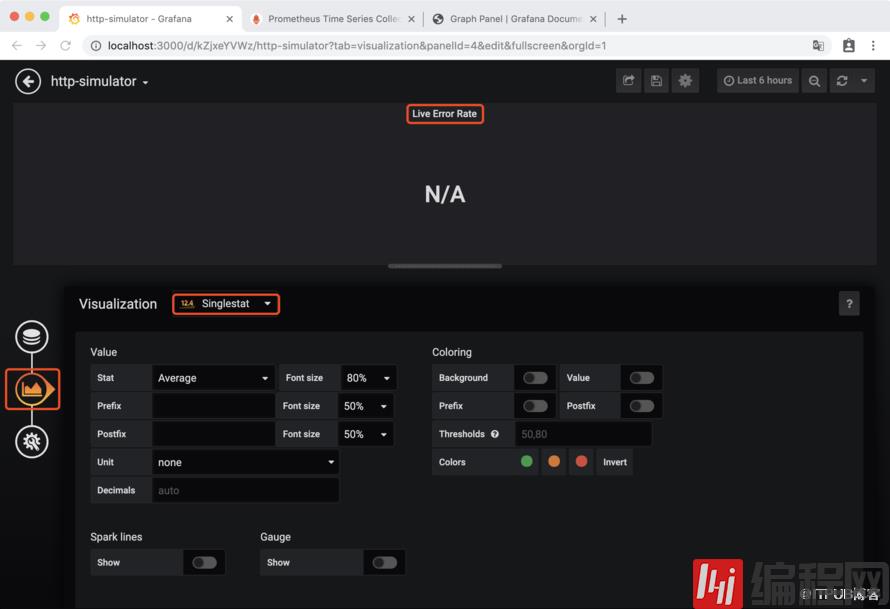
点击 “Add panel图标” ,添加一个新的 Pannel,点击 “Choose Visualization” 选择可视化 图表的类型,点击 “Singlestat” 图标添加一个 Singlestat,修改 Panel Title 为 Live Error Rate
点击 “Queries” 输入 Prometheus 表达式
sum(rate(http_requests_total{job="http-simulator", status="500"}[5m])) / sum(rate(http_requests_total{job="http-simulator"}[5m]))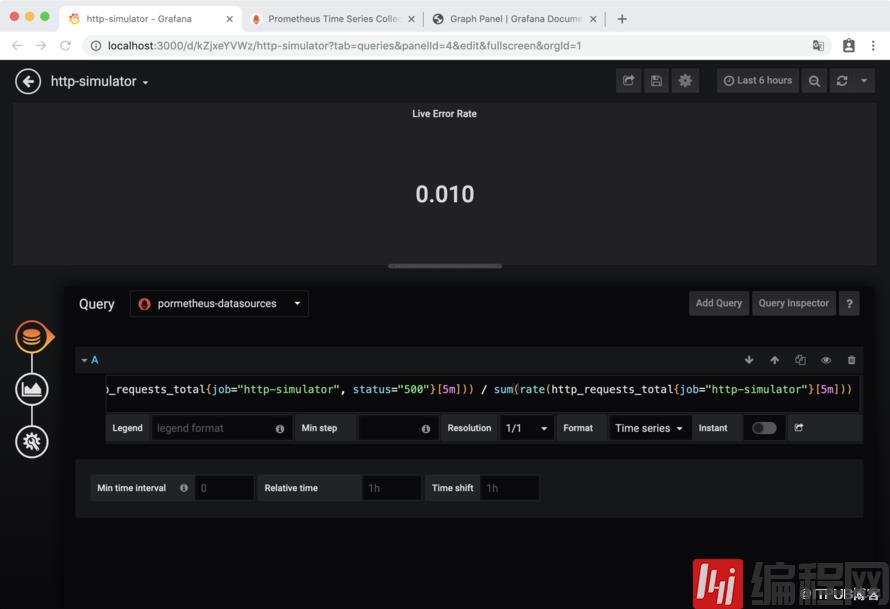
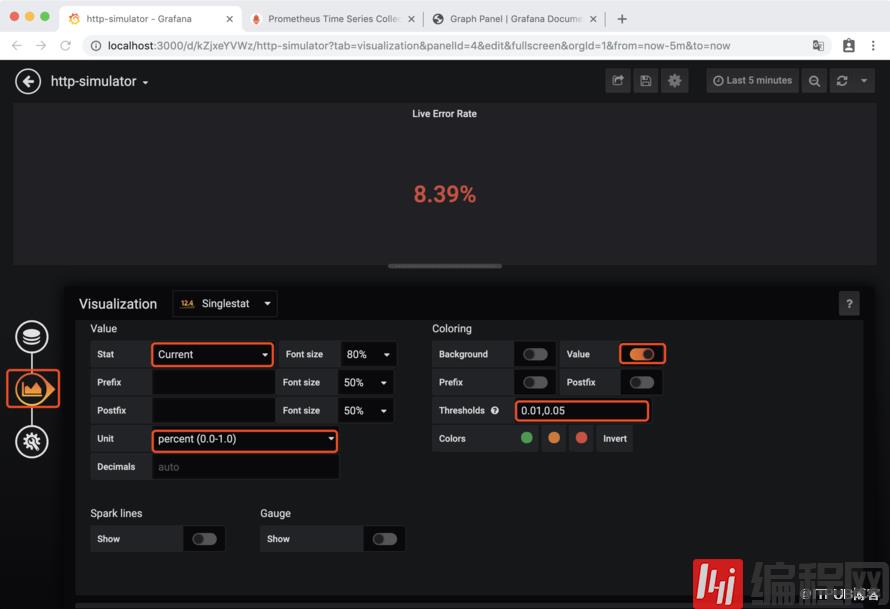
调整显示单位unit,设置为None->percent(0.0-1.0),然后调整显示值(目前为平均)为当前值(now):Options->Value->Stat,设置为Current
添加阀值和颜色,在 Coloring 下,选中Value,将Threshold设置为0.01,0.05,表示
绿色:0-1%
橙色:1-5%
红色:>5%
添加测量仪效果,在 Gauge 下,选中Show,并将 Max设为 1

最后别忘了 “Control + S” 或 点击 右上方的 “保存” 图标,保存修改后的Dashbaord。
展示 Top requested 端点
添加一个新的 Pannel,点击 “Choose Visualization” 选择可视化 图表的类型,点击 “Table” 图标添加一个 Table,修改 Panel Title 为 Top requested
点击 “Queries” 输入 Prometheus 表达式
sum(rate(http_requests_total{job="http-simulator"}[5m])) by (endpoint)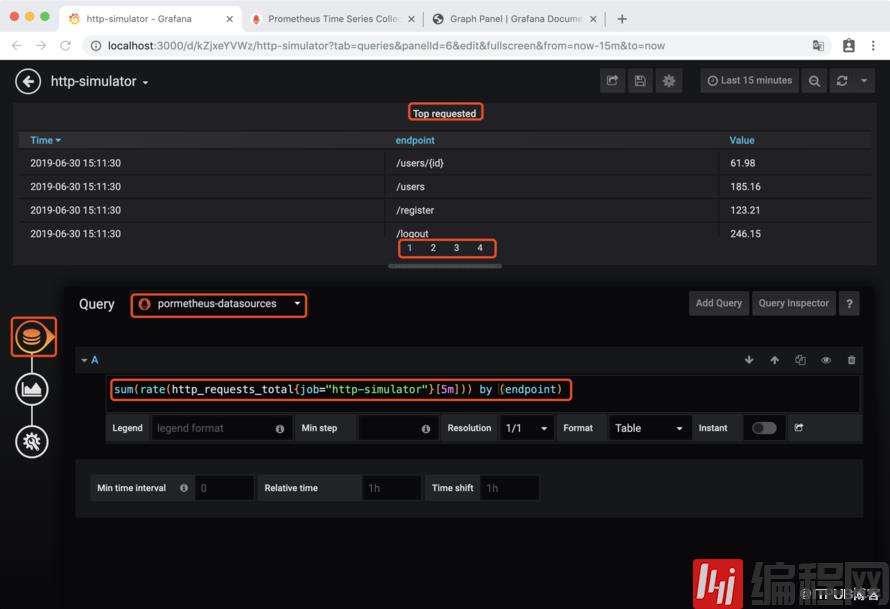
减少表中数据项,选中Instant只显示当前值
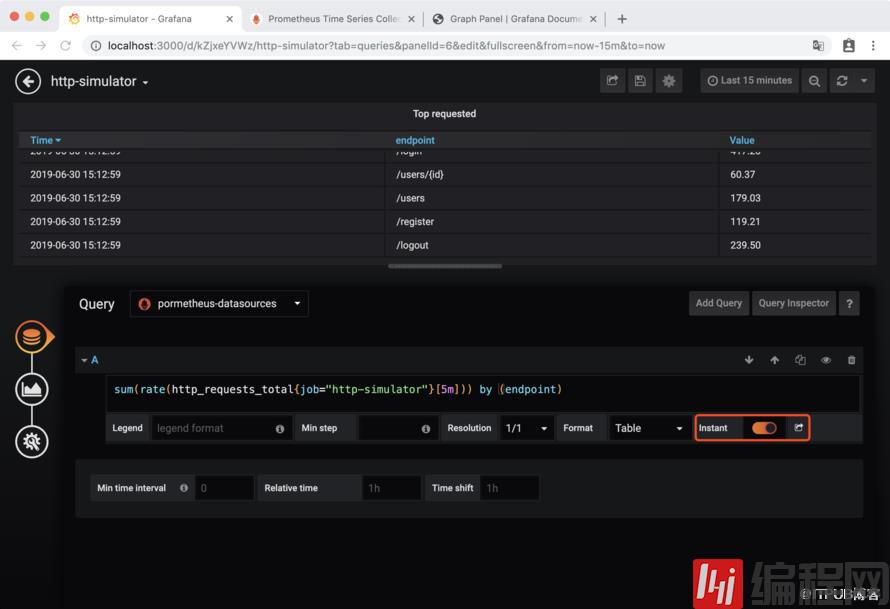
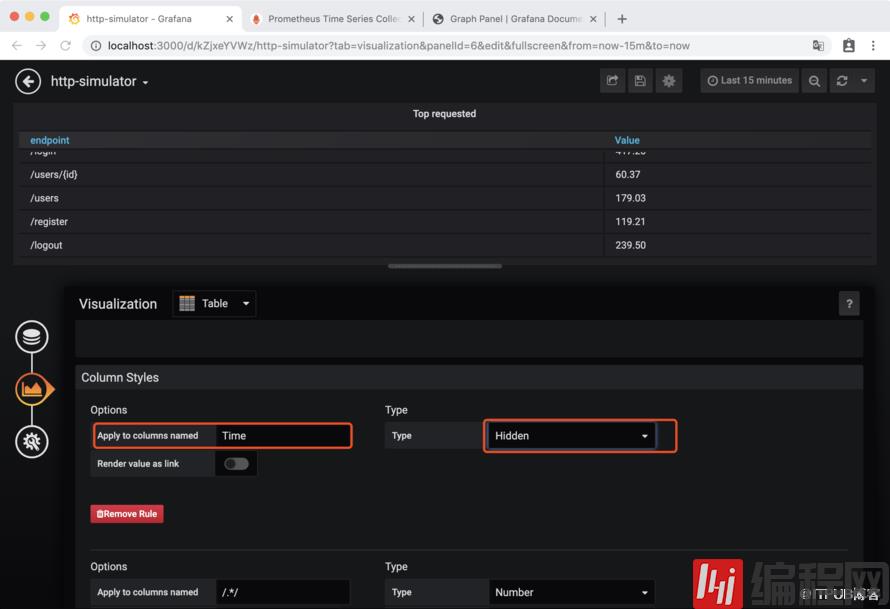
隐藏Time列,在 Column Sytle 下,Apply to columns named为Time,将Type->Type设置为Hidden
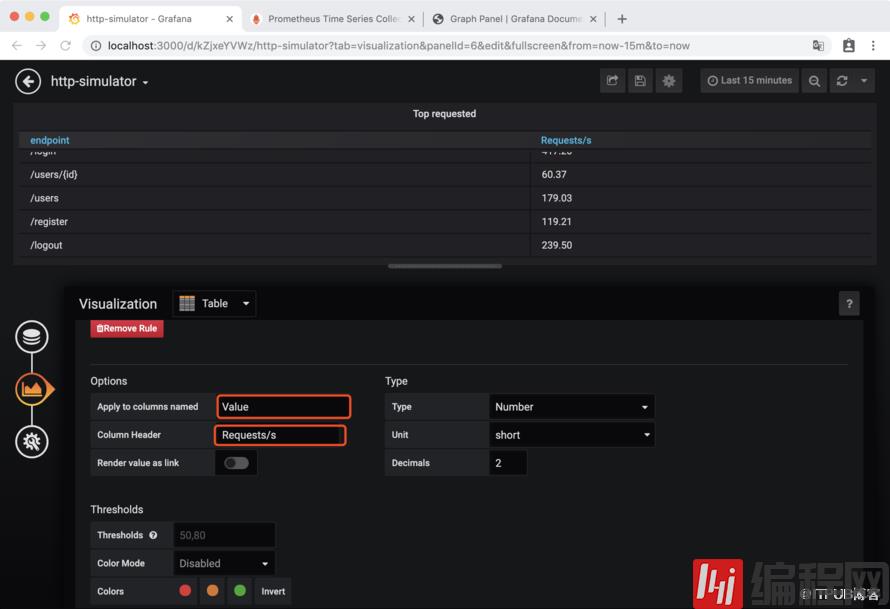
将Value列重命名,添加一个Column Style,Apply to columns named设为Value,将Column Header设置为Requests/s
点击表中的 Requests/s header,让其中数据根据端点活跃度进行排序。

保存修改后的Dashbaord。
关于“Prometheus与Grafana如何集成”这篇文章就分享到这里了,希望以上内容可以对大家有一定的帮助,使各位可以学到更多知识,如果觉得文章不错,请把它分享出去让更多的人看到。


