Python 使用 NetworkX
说明:本篇文章主要讲述 python 使用 networkx 绘制有向图;
1. 介绍&安装
NetworkX 是一个用于创建、操作和研究复杂网络的 Python 库。它提供了丰富的功能,可以帮助你创建、分析和可视化各种类型的网络,例如社交网络、Web图、生物网络等。NetworkX 可以用来创建各种类型的网络,包括有向图和无向图。它提供了各种方法来添加、删除和修改网络中的节点和边。你可以使用节点和边的属性来进一步描述网络的特性。
NetworkX 还提供了许多图的算法和分析工具。你可以使用这些工具来计算各种网络指标,比如节点的度、网络的直径、最短路径等。你还可以使用它来发现社区结构、进行图的聚类分析等。
除了功能强大的操作和分析工具,NetworkX还提供了多种方式来可视化网络。你可以使用它来绘制网络的节点和边,设置节点的颜色、尺寸和标签等。
总的来说,NetworkX是一个功能丰富、灵活易用的Python库,用于创建、操作和研究各种类型的复杂网络。无论你是在进行学术研究、数据分析还是网络可视化,NetworkX都是一个不错的选择。
安装
pip install networkx2. 简单的有向图绘制
简单的类展示
import networkx as nx # 导入 NetworkX 工具包# 创建 图G1 = nx.Graph() # 创建:空的 无向图G2 = nx.DiGraph() #创建:空的 有向图G3 = nx.MultiGraph() #创建:空的 多图G4 = nx.MultiDiGraph() #创建:空的 有向多图三节点有向图的绘制
# -*- coding: utf-8 -*-import networkx as nximport matplotlib.pyplot as plt# 1. 创建有向图对象, 创建空的有向图的对象G = nx.DiGraph()# 2. 添加节点G.add_node('A')G.add_node('B')G.add_node('C')# 3. 添加有向边G.add_edge('A', 'B')G.add_edge('B', 'C')# 4. 进行图的绘制pos = nx.spring_layout(G) # 选择布局算法;nx.draw(G, pos, with_labels=True)plt.show()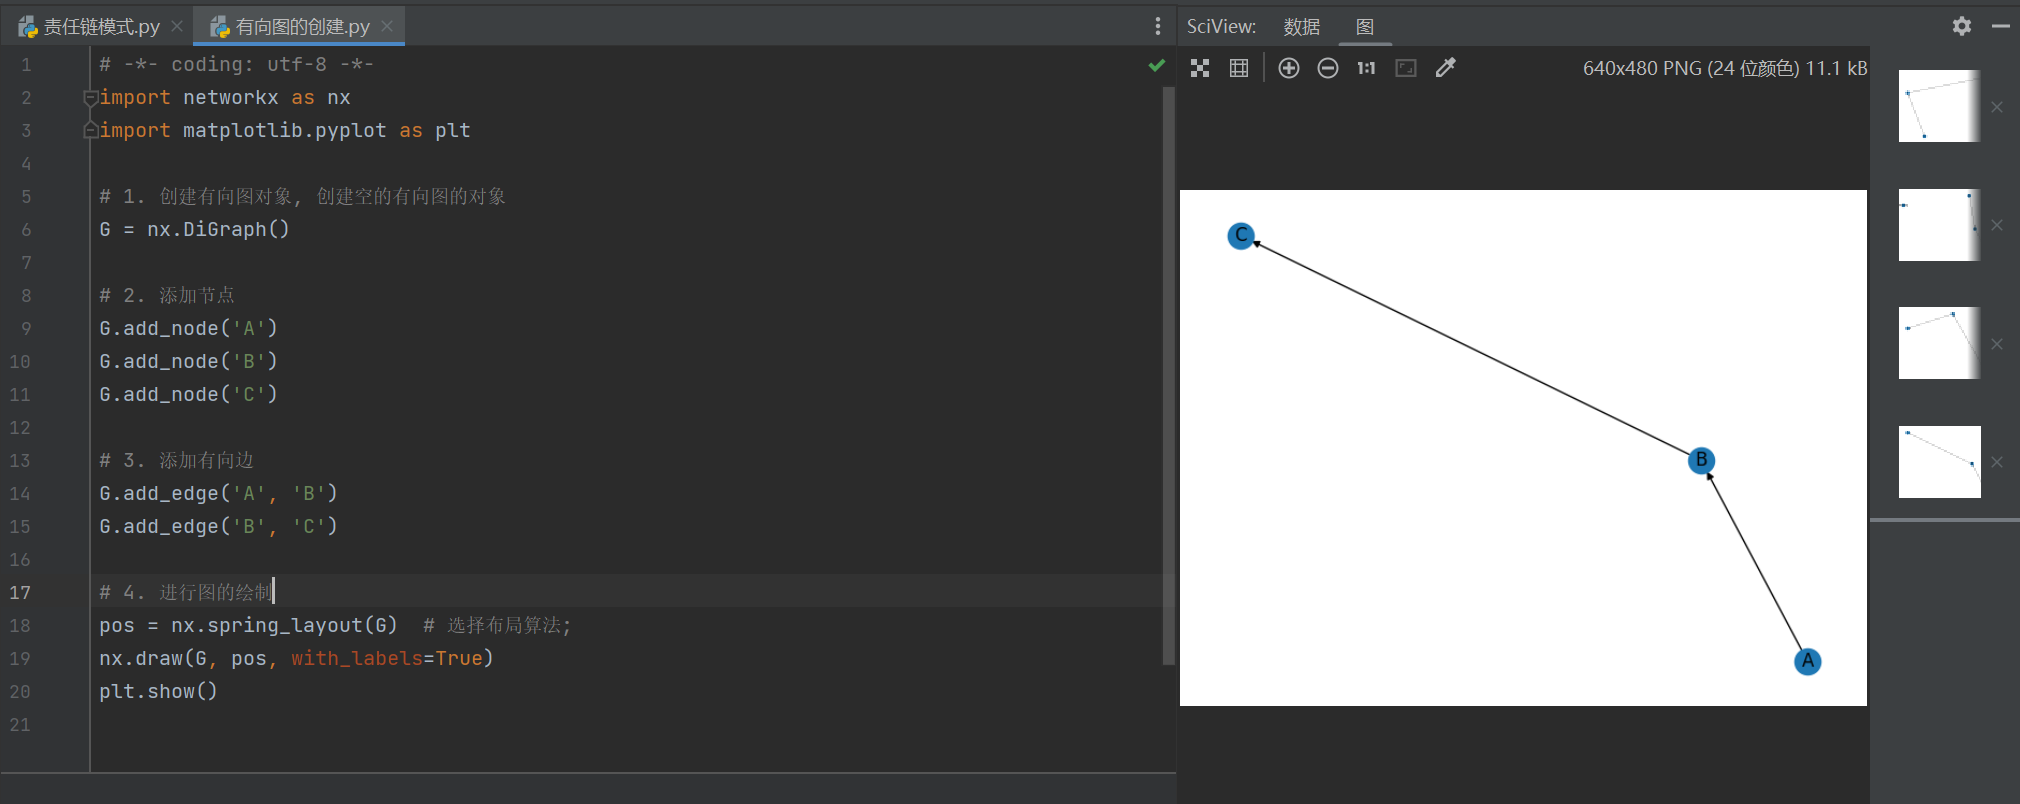
绘制分支节点的有向图
# -*- coding: utf-8 -*-import networkx as nximport matplotlib.pyplot as plt# 1. 创建有向图对象, 创建空的有向图的对象G = nx.DiGraph()# 2. 添加节点G.add_node('A')G.add_node('B')G.add_node('C')G.add_node('D')G.add_node('E')# 3. 添加有向边G.add_edge('A', 'B')G.add_edge('B', 'C')G.add_edge('B', 'D')G.add_edge('C', 'E')# 4. 进行图的绘制pos = nx.spring_layout(G) # 选择布局算法;nx.draw(G, pos, with_labels=True)plt.show()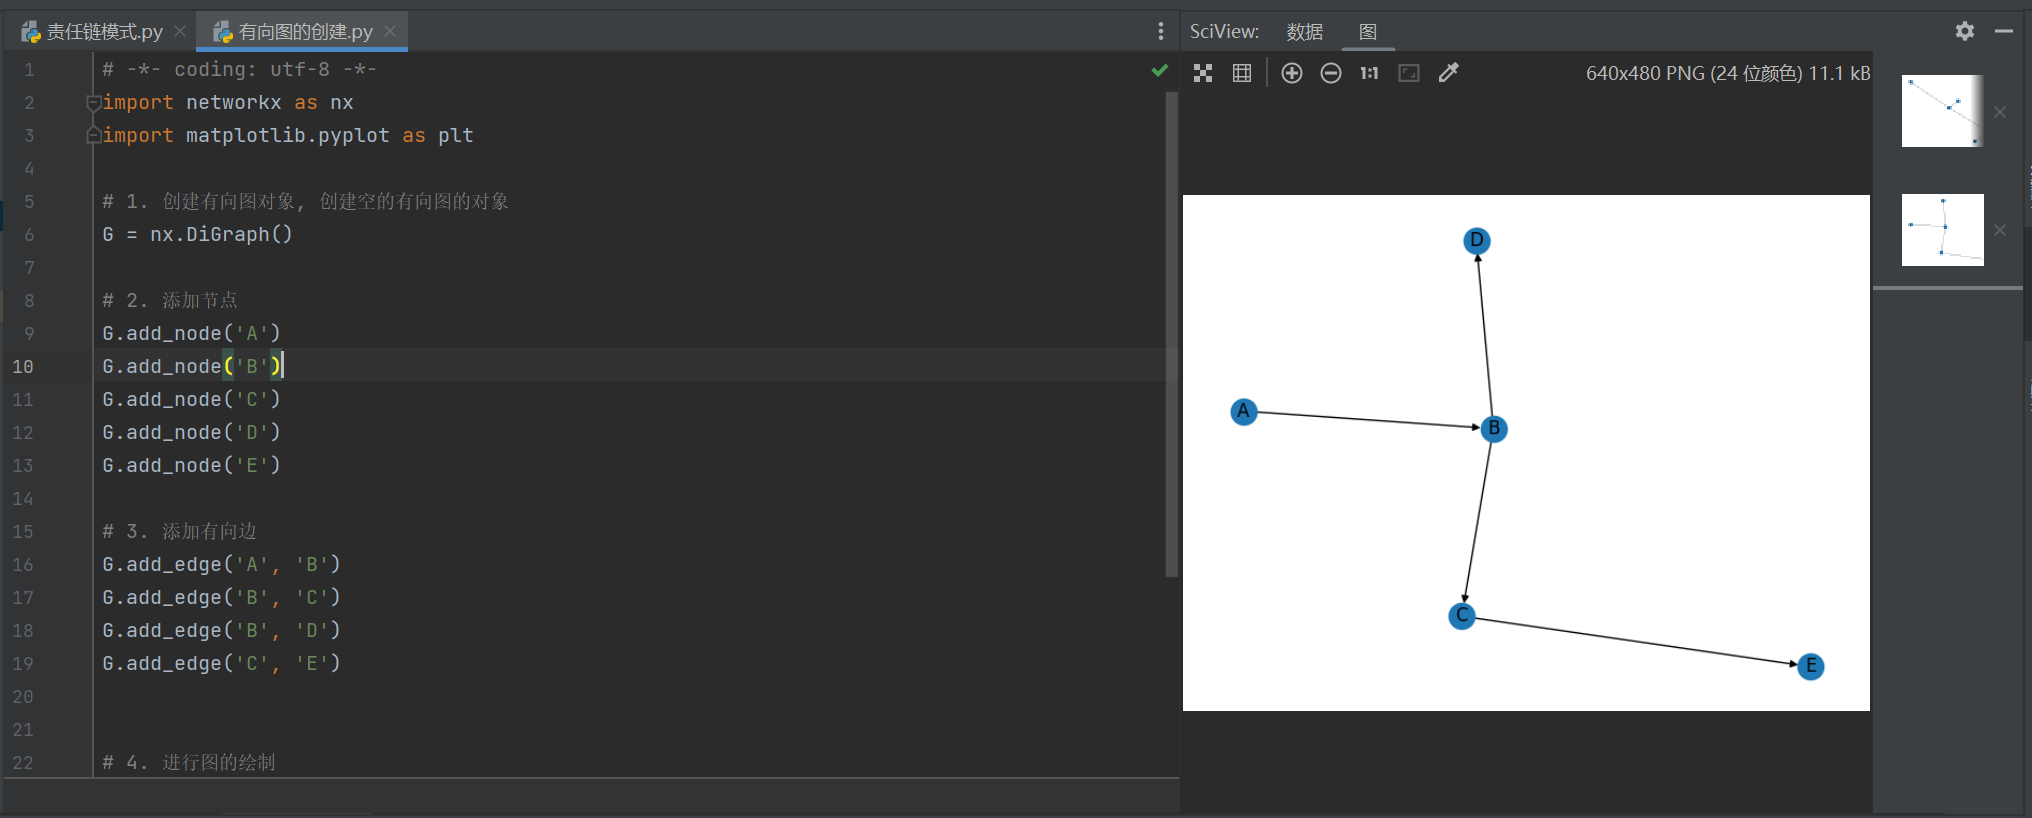
3.有向图的遍历
三节点有向图的遍历
# -*- coding: utf-8 -*-import networkx as nximport matplotlib.pyplot as plt# 1. 创建有向图对象, 创建空的有向图的对象G = nx.DiGraph()# 2. 添加节点G.add_node('A')G.add_node('B')G.add_node('C')# G.add_node('D')# G.add_node('E')# 3. 添加有向边G.add_edge('A', 'B')G.add_edge('B', 'C')# G.add_edge('B', 'D')# G.add_edge('C', 'E')# 4. 进行图的绘制pos = nx.spring_layout(G) # 选择布局算法;nx.draw(G, pos, with_labels=True)plt.show()# 5. 有向图的遍历print(G.nodes) # 节点列表, 输出节点 列表for node in G.nodes(): print("节点>>>", node)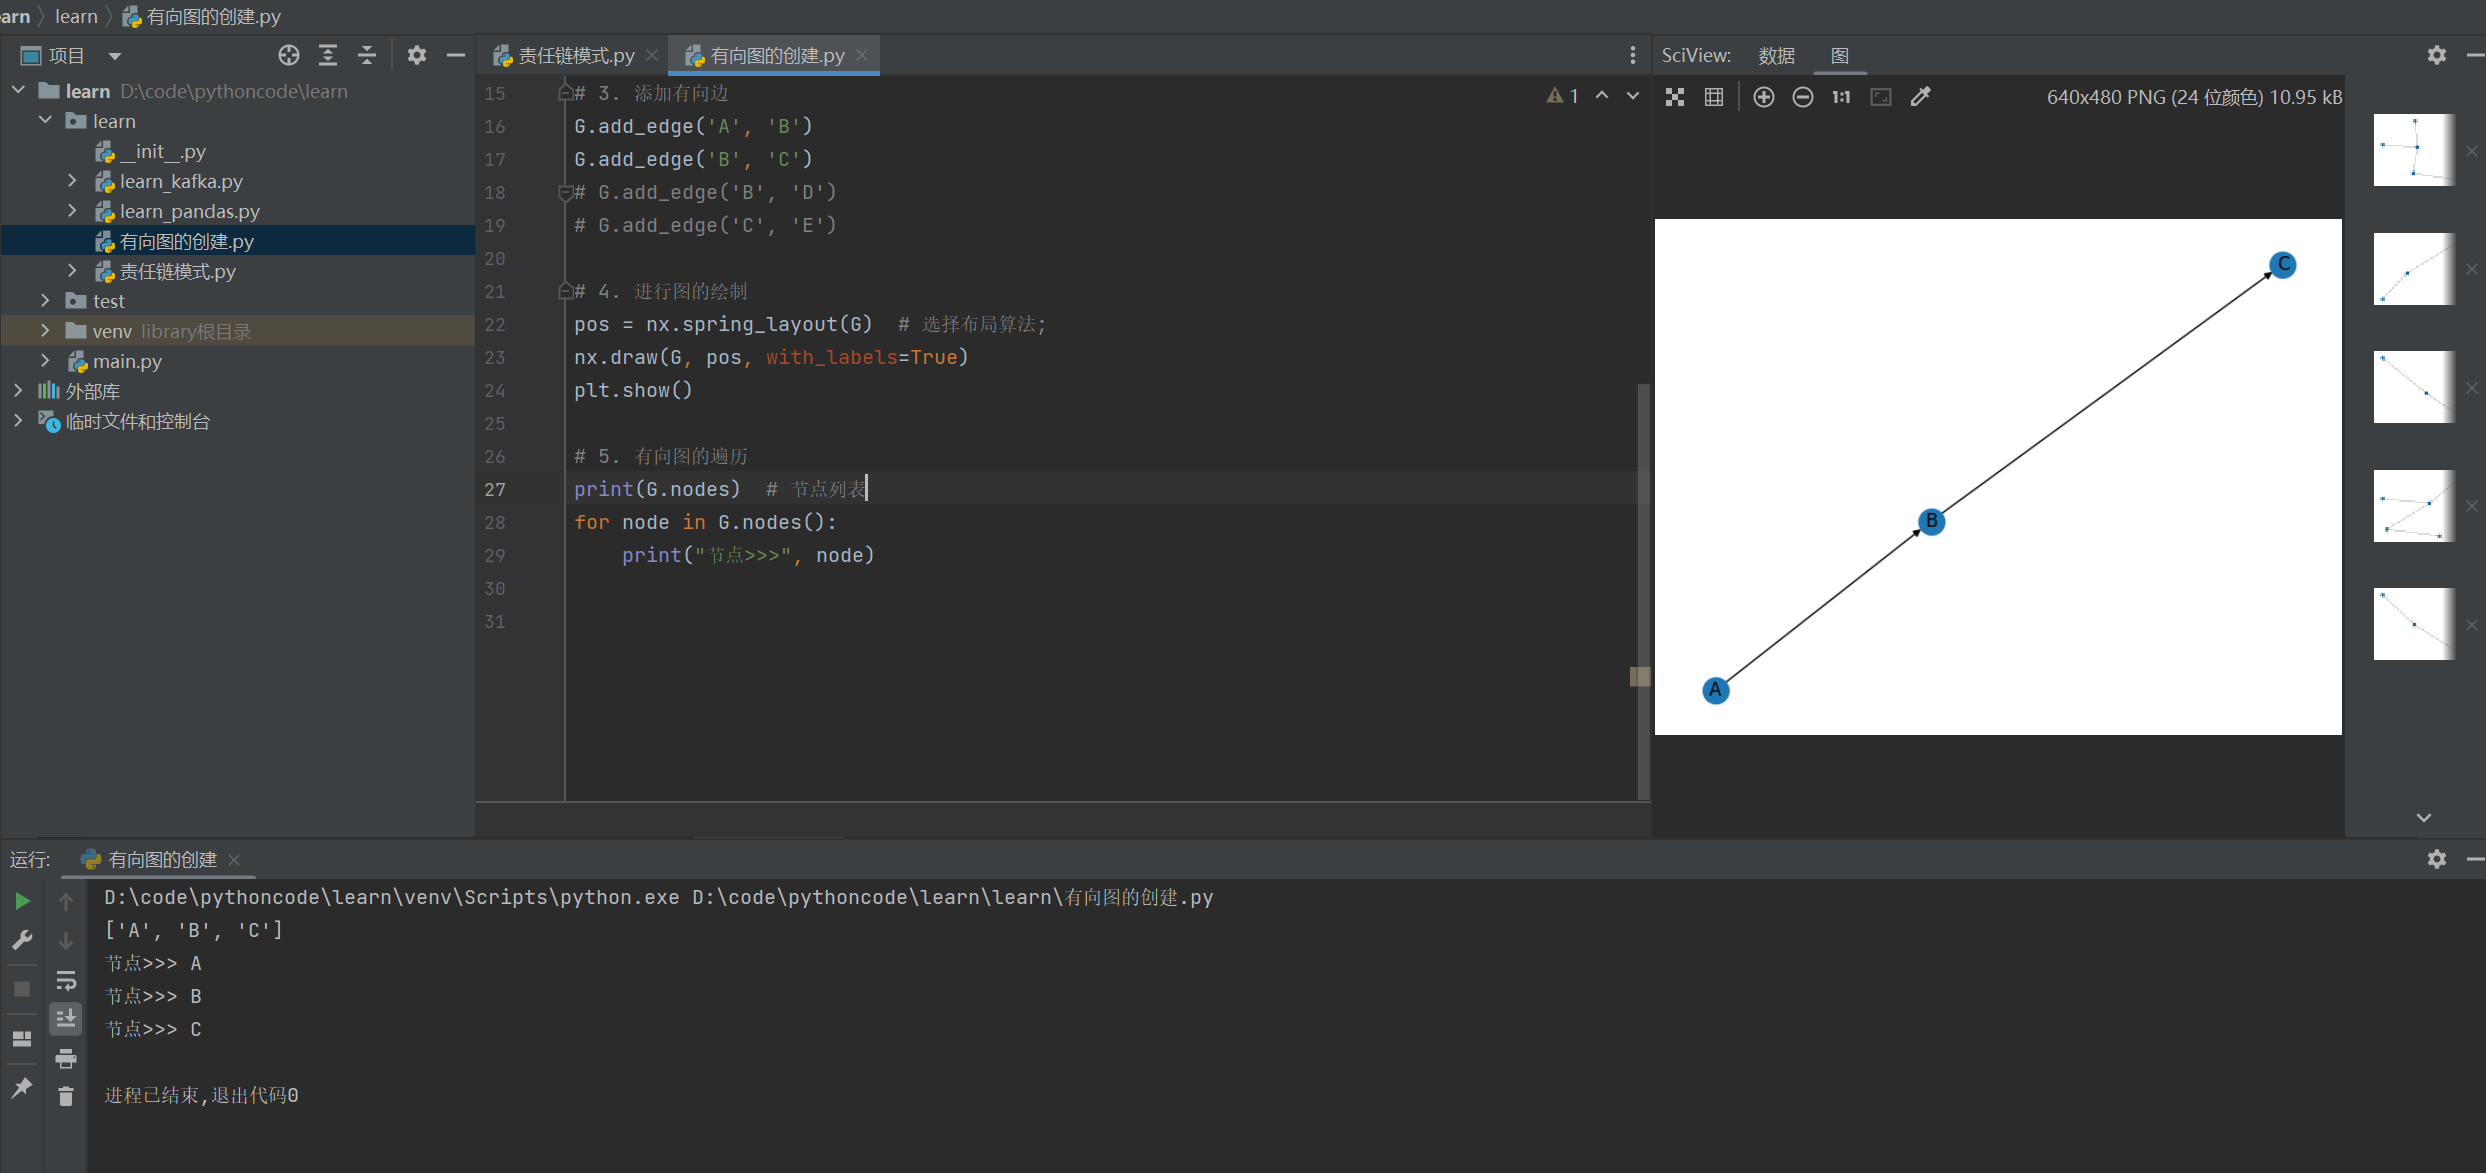
绘制分支节点图形的输出
# -*- coding: utf-8 -*-import networkx as nximport matplotlib.pyplot as plt# 1. 创建有向图对象, 创建空的有向图的对象G = nx.DiGraph()# 2. 添加节点G.add_node('A')G.add_node('B')G.add_node('C')G.add_node('D')G.add_node('E')# 3. 添加有向边G.add_edge('A', 'B')G.add_edge('B', 'C')G.add_edge('B', 'D')G.add_edge('C', 'E')# 4. 进行图的绘制pos = nx.spring_layout(G) # 选择布局算法;nx.draw(G, pos, with_labels=True)plt.show()# 5. 有向图的遍历print(G.nodes) # 节点列表# print(G.edges) # 边列表, [('A', 'B'), ('B', 'C'), ('B', 'D'), ('C', 'E')]for node in G.nodes(): print("节点>>>", node) in_degree = G.in_degree(node) print("入度:", in_degree) # 获取节点的出度 out_degree = G.out_degree(node) print("出度:", out_degree) # 获取节点的邻居节点 neighbors = G.neighbors(node) print("邻居节点:", list(neighbors))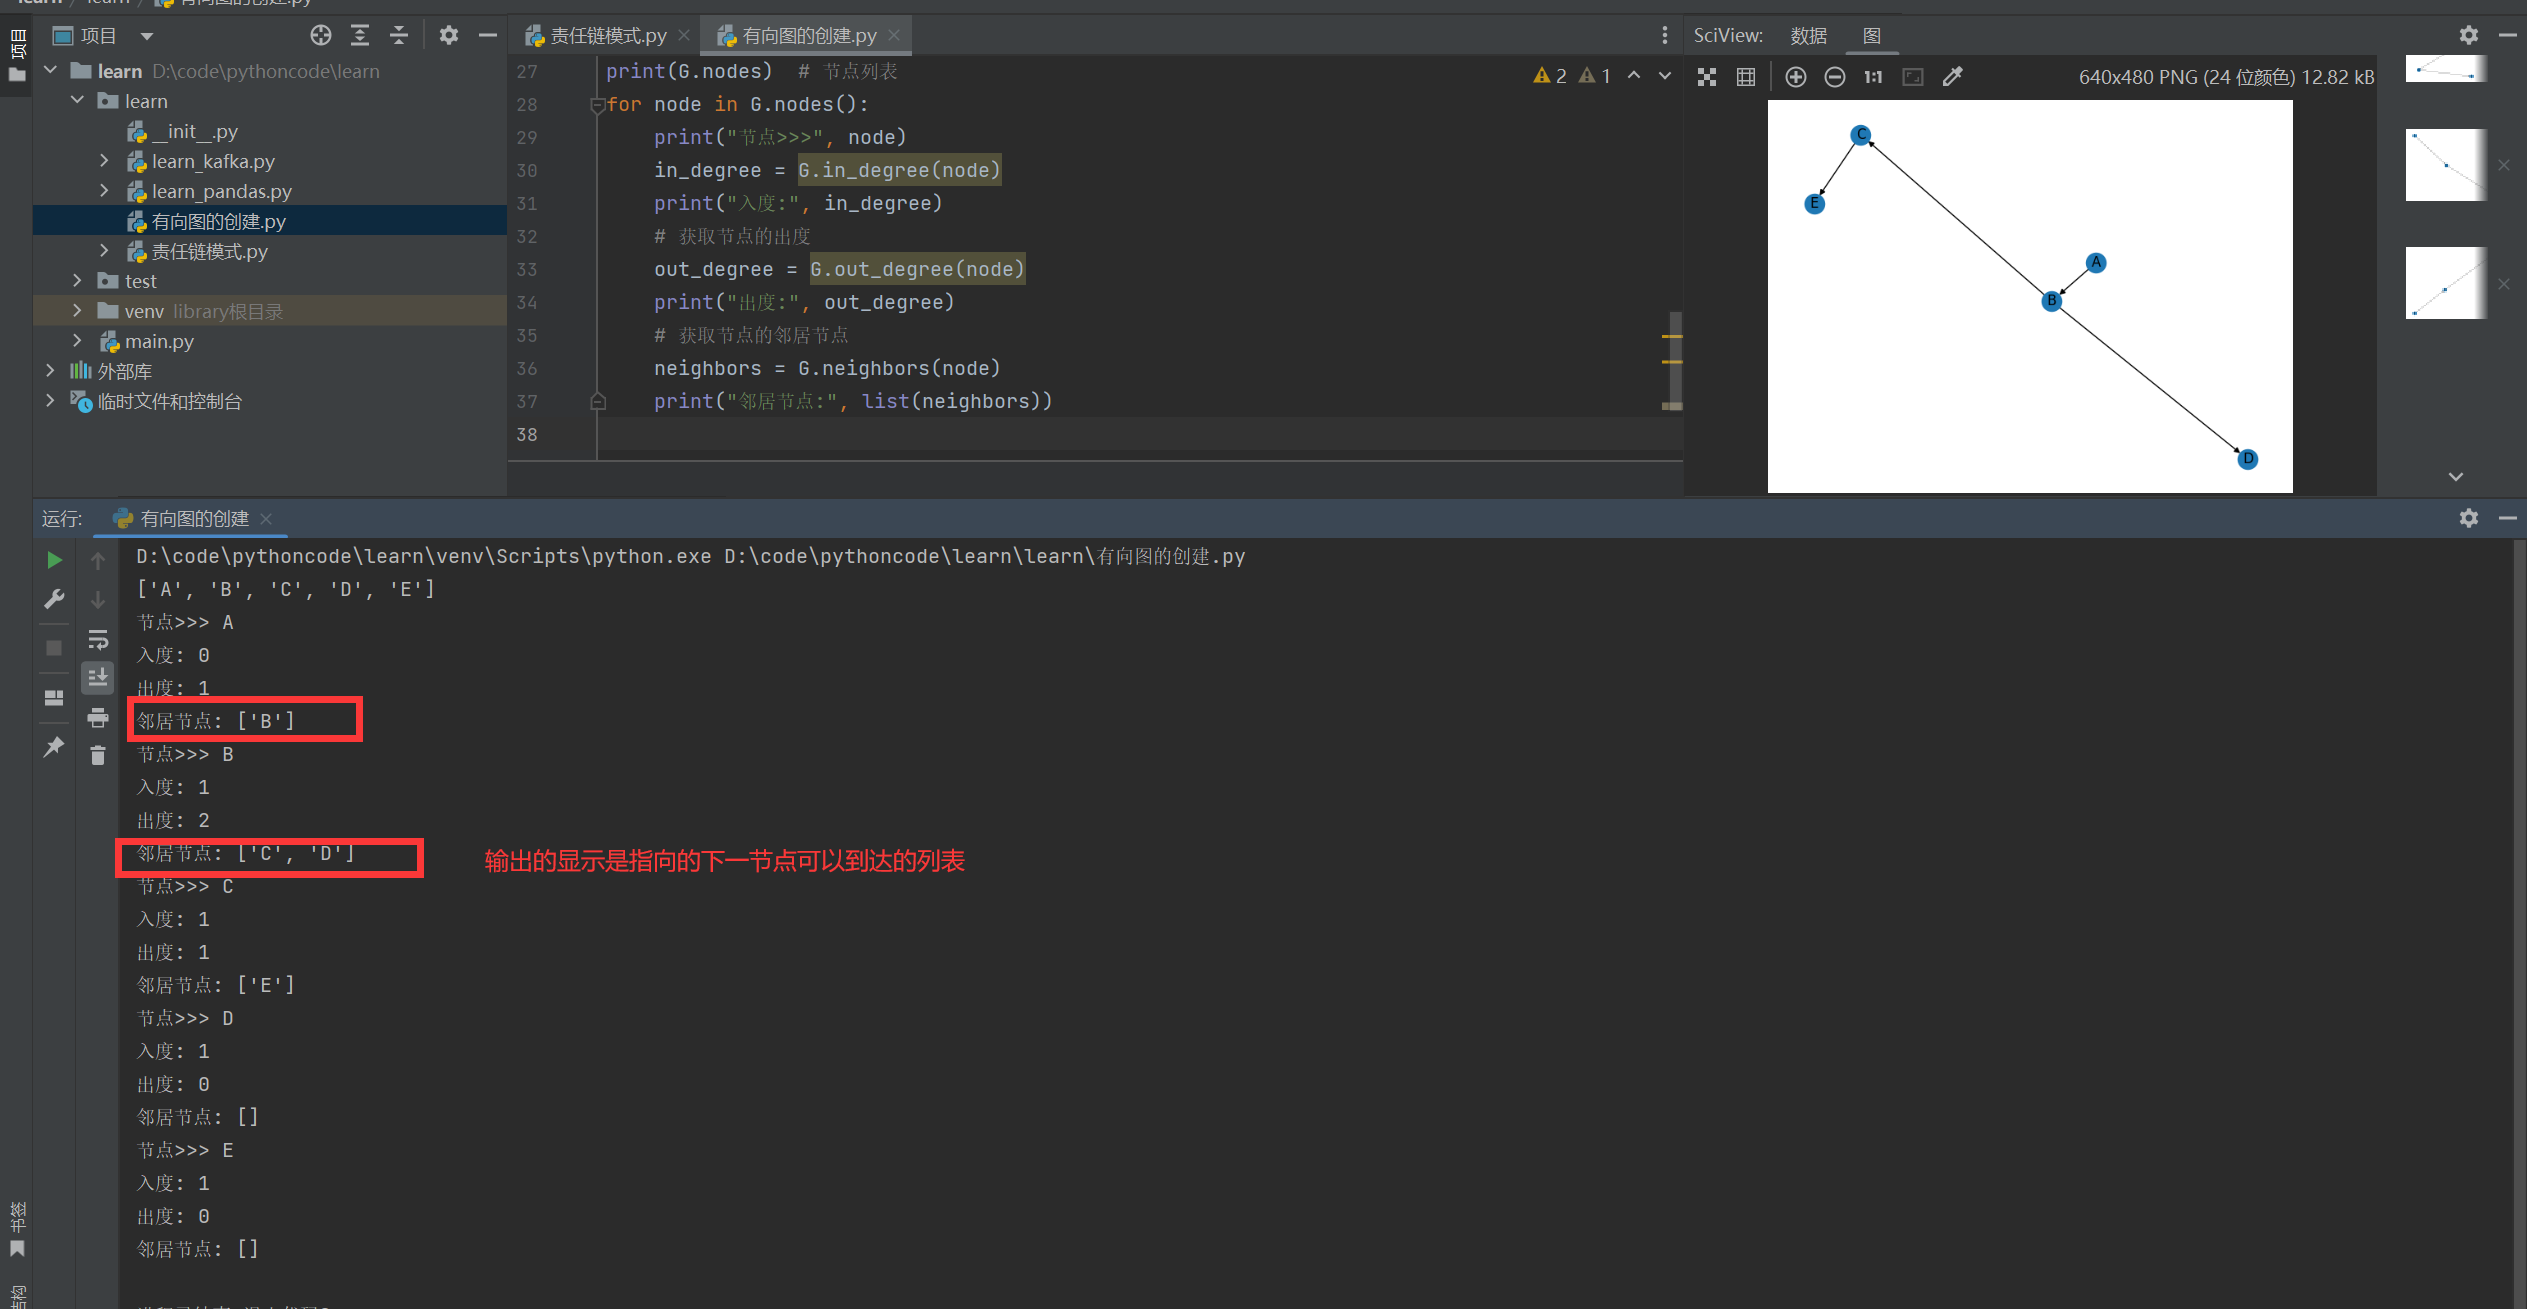
4.带权重的边
本章节的内容主要展示带权重的边的绘制,并且求取出最大值和最小值;
# -*- coding: utf-8 -*-import networkx as nximport matplotlib.pyplot as plt# 创建有向图G = nx.DiGraph()# 直接创建边, 自动添加两个节点, 并且设置边的权重G.add_edge('A', 'B', weight=3)G.add_edge('B', 'C', weight=5)G.add_edge('C', 'D', weight=2)G.add_edge('C', 'E', weight=5)pos = nx.spring_layout(G)nx.draw(G, pos, with_labels=True)# 获取边的权重labels = nx.get_edge_attributes(G, 'weight')# 绘制带有权重的边nx.draw_networkx_edge_labels(G, pos, edge_labels=labels)plt.show()# 获取边的权重值列表weights = nx.get_edge_attributes(G, 'weight').values()print("边的权重值列表>>>", weights)max_weight = max(weights)min_weight = min(weights)print("最大权重的边:", max_weight)print("最小权重的边:", min_weight)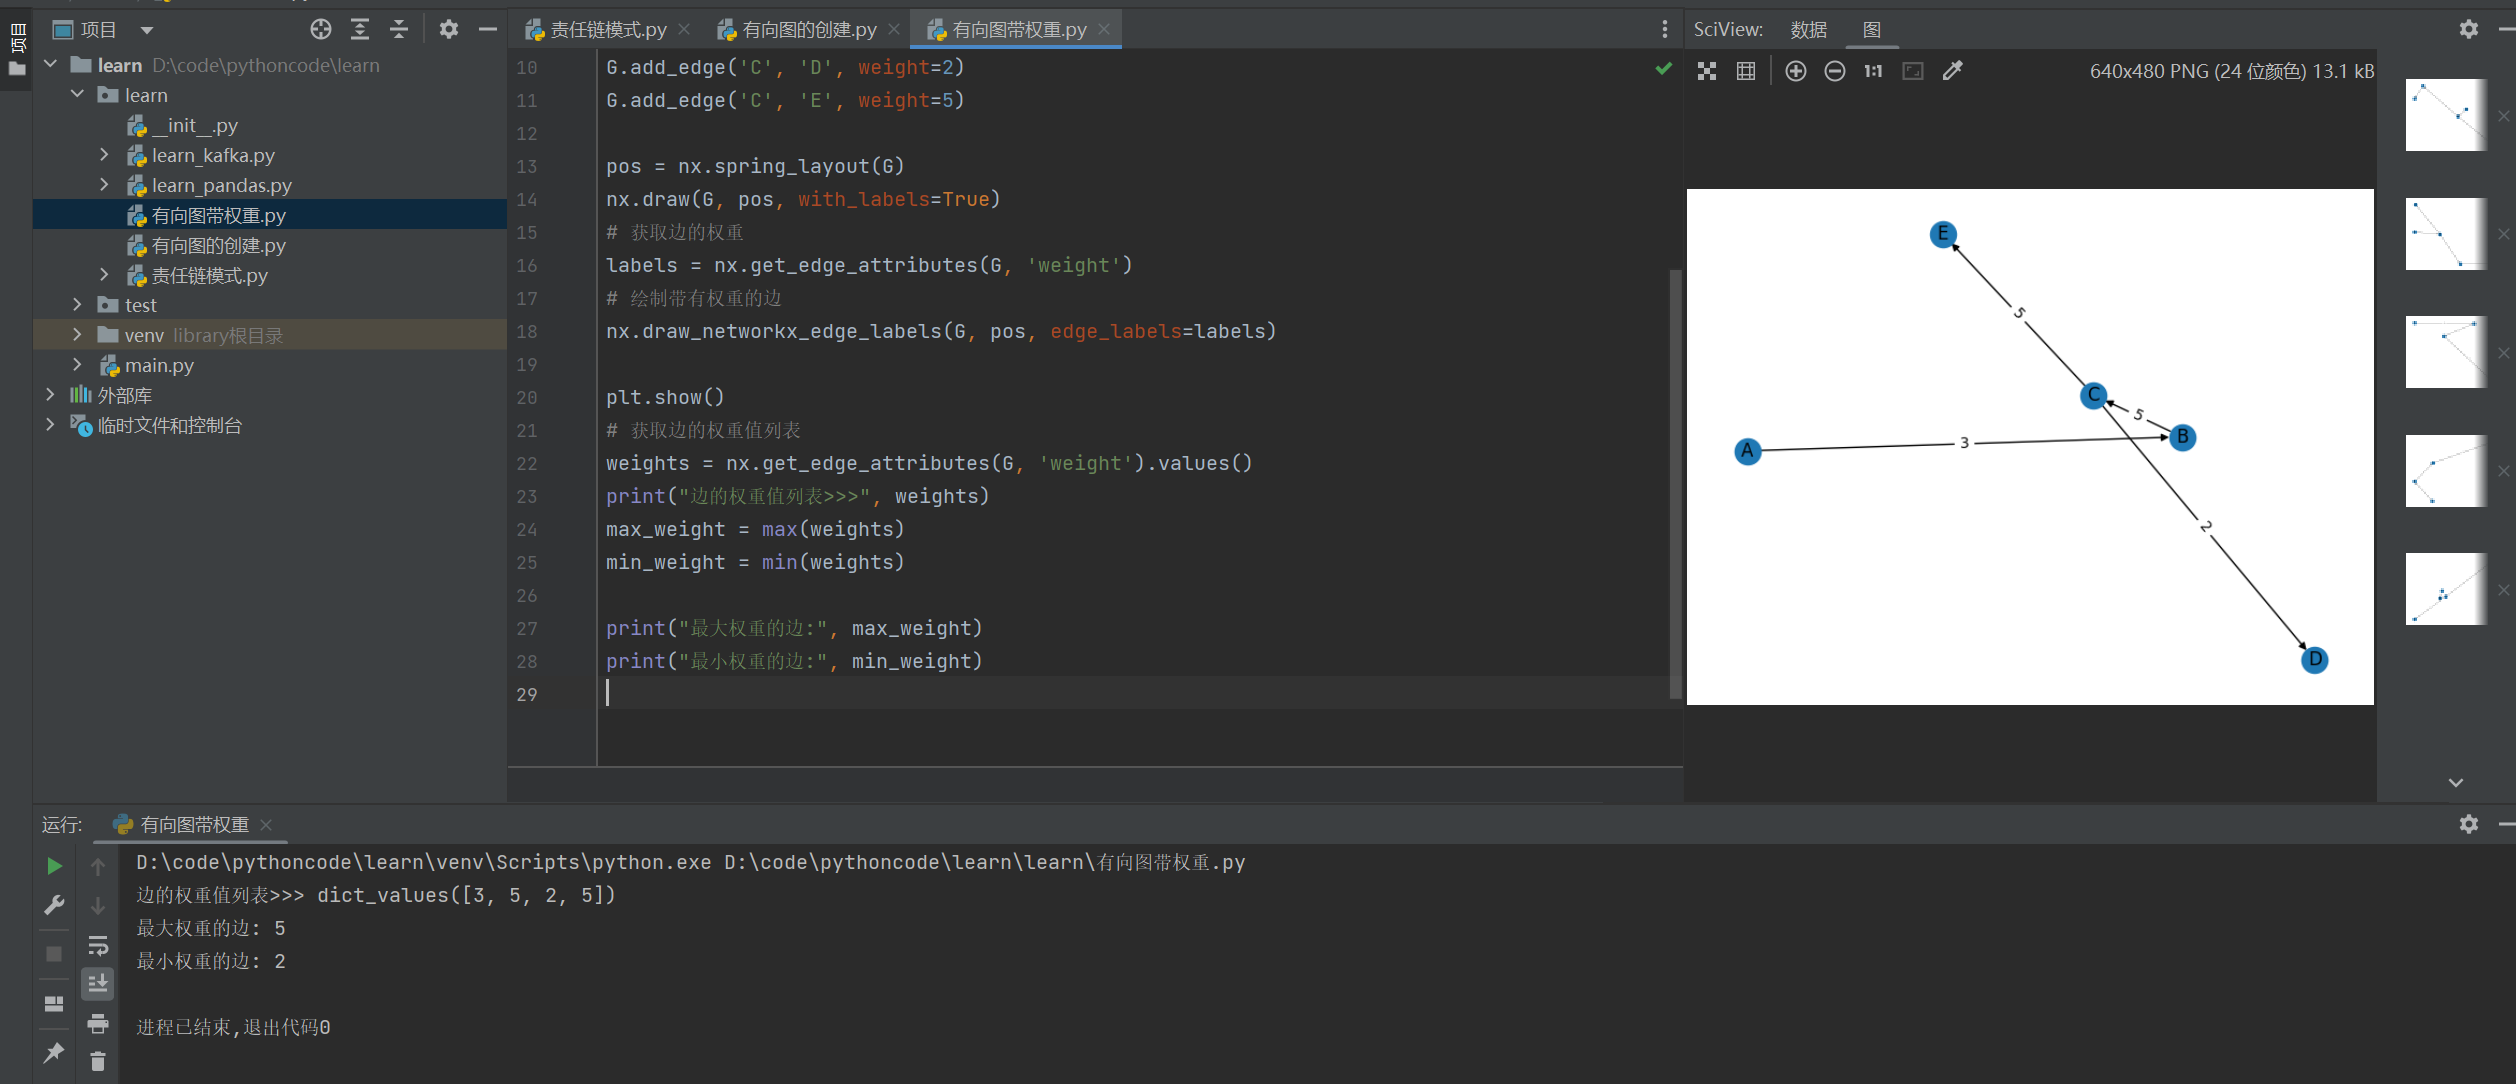
求取图形中得最短路径
# -*- coding: utf-8 -*-import networkx as nximport matplotlib.pyplot as pltdef get_shortest_path(graph, source, target): try: shortest_path = nx.shortest_path(graph, source, target) return shortest_path except nx.exception.NetworkXNoPath: return "不存在最短路径"def get_longest_path(graph, source, target): all_paths = nx.all_simple_paths(graph, source, target) longest_path = max(all_paths, key=len) return longest_path# 创建有向图G = nx.DiGraph()G.add_edge('A', 'B')G.add_edge('A', 'C')G.add_edge('B', 'C')G.add_edge('B', 'D')G.add_edge('C', 'D')pos = nx.spring_layout(G) # 选择布局算法;nx.draw(G, pos, with_labels=True)plt.show()# 求取最短路径shortest_path = get_shortest_path(G, 'A', 'D')print("最短路径:", shortest_path)# 求取最长路径longest_path = get_longest_path(G, 'A', 'D')print("最长路径:", longest_path)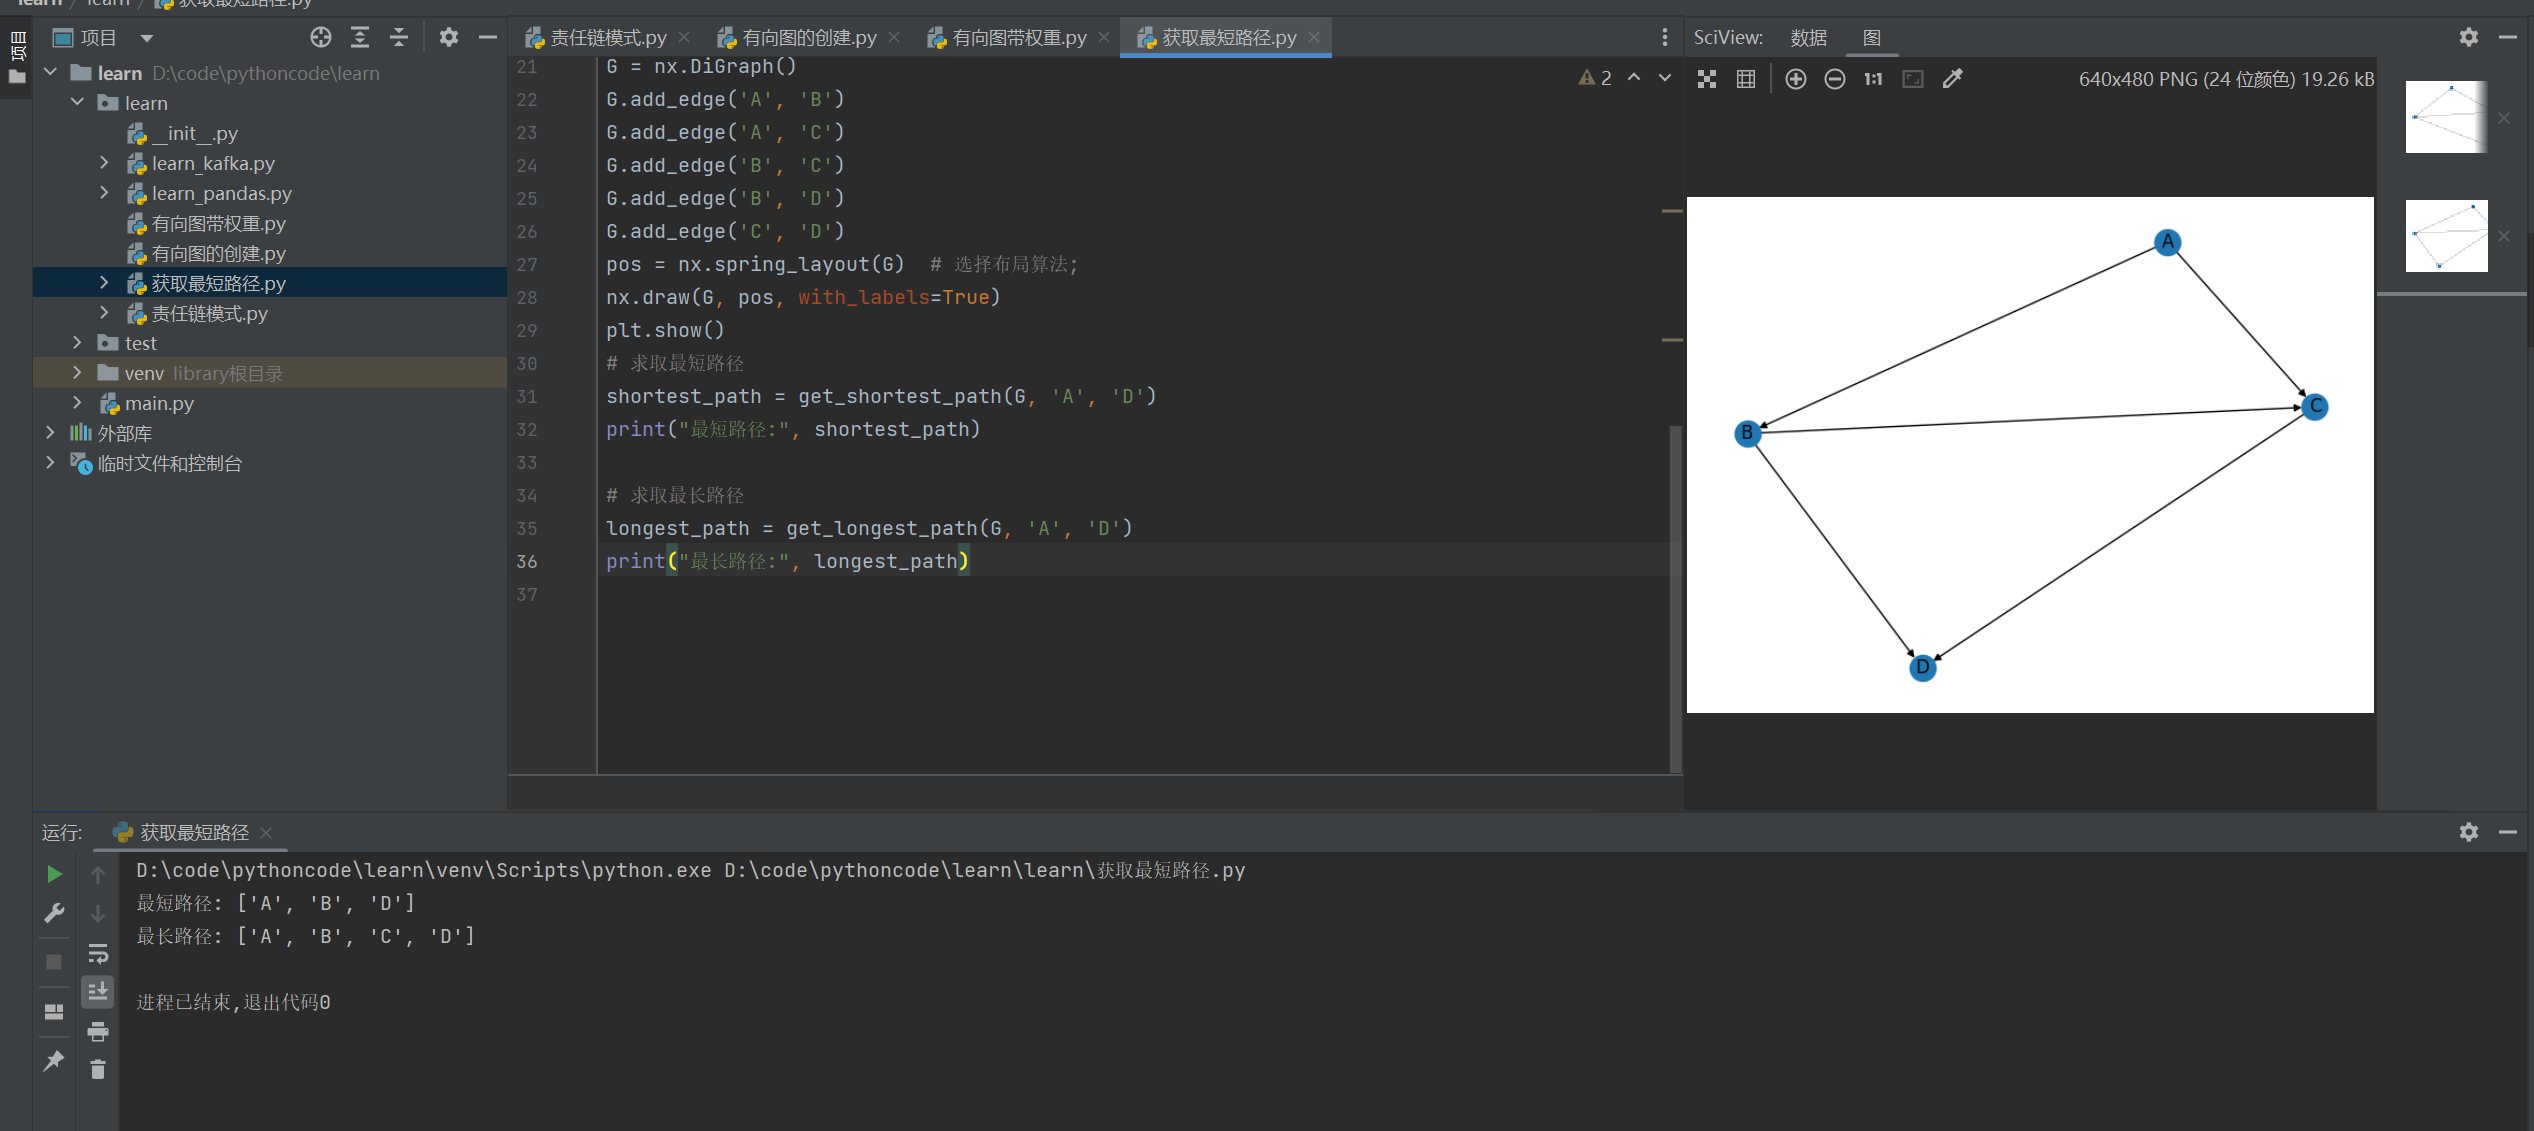
按照权重求最短路径&最长路径
# -*- coding: utf-8 -*-import networkx as nximport matplotlib.pyplot as plt# 创建有向带权重图G = nx.DiGraph()G.add_edge('A', 'B', weight=3)G.add_edge('A', 'C', weight=5)G.add_edge('B', 'C', weight=2)G.add_edge('B', 'D', weight=4)G.add_edge('C', 'D', weight=1)pos = nx.spring_layout(G)nx.draw(G, pos, with_labels=True)# 获取边的权重labels = nx.get_edge_attributes(G, 'weight')# 绘制带有权重的边nx.draw_networkx_edge_labels(G, pos, edge_labels=labels)plt.show()# 按照权重求取最短路径shortest_path = nx.dijkstra_path(G, 'A', 'D', weight='weight')shortest_distance = nx.dijkstra_path_length(G, 'A', 'D', weight='weight')print("最短路径:", shortest_path)print("最短距离:", shortest_distance)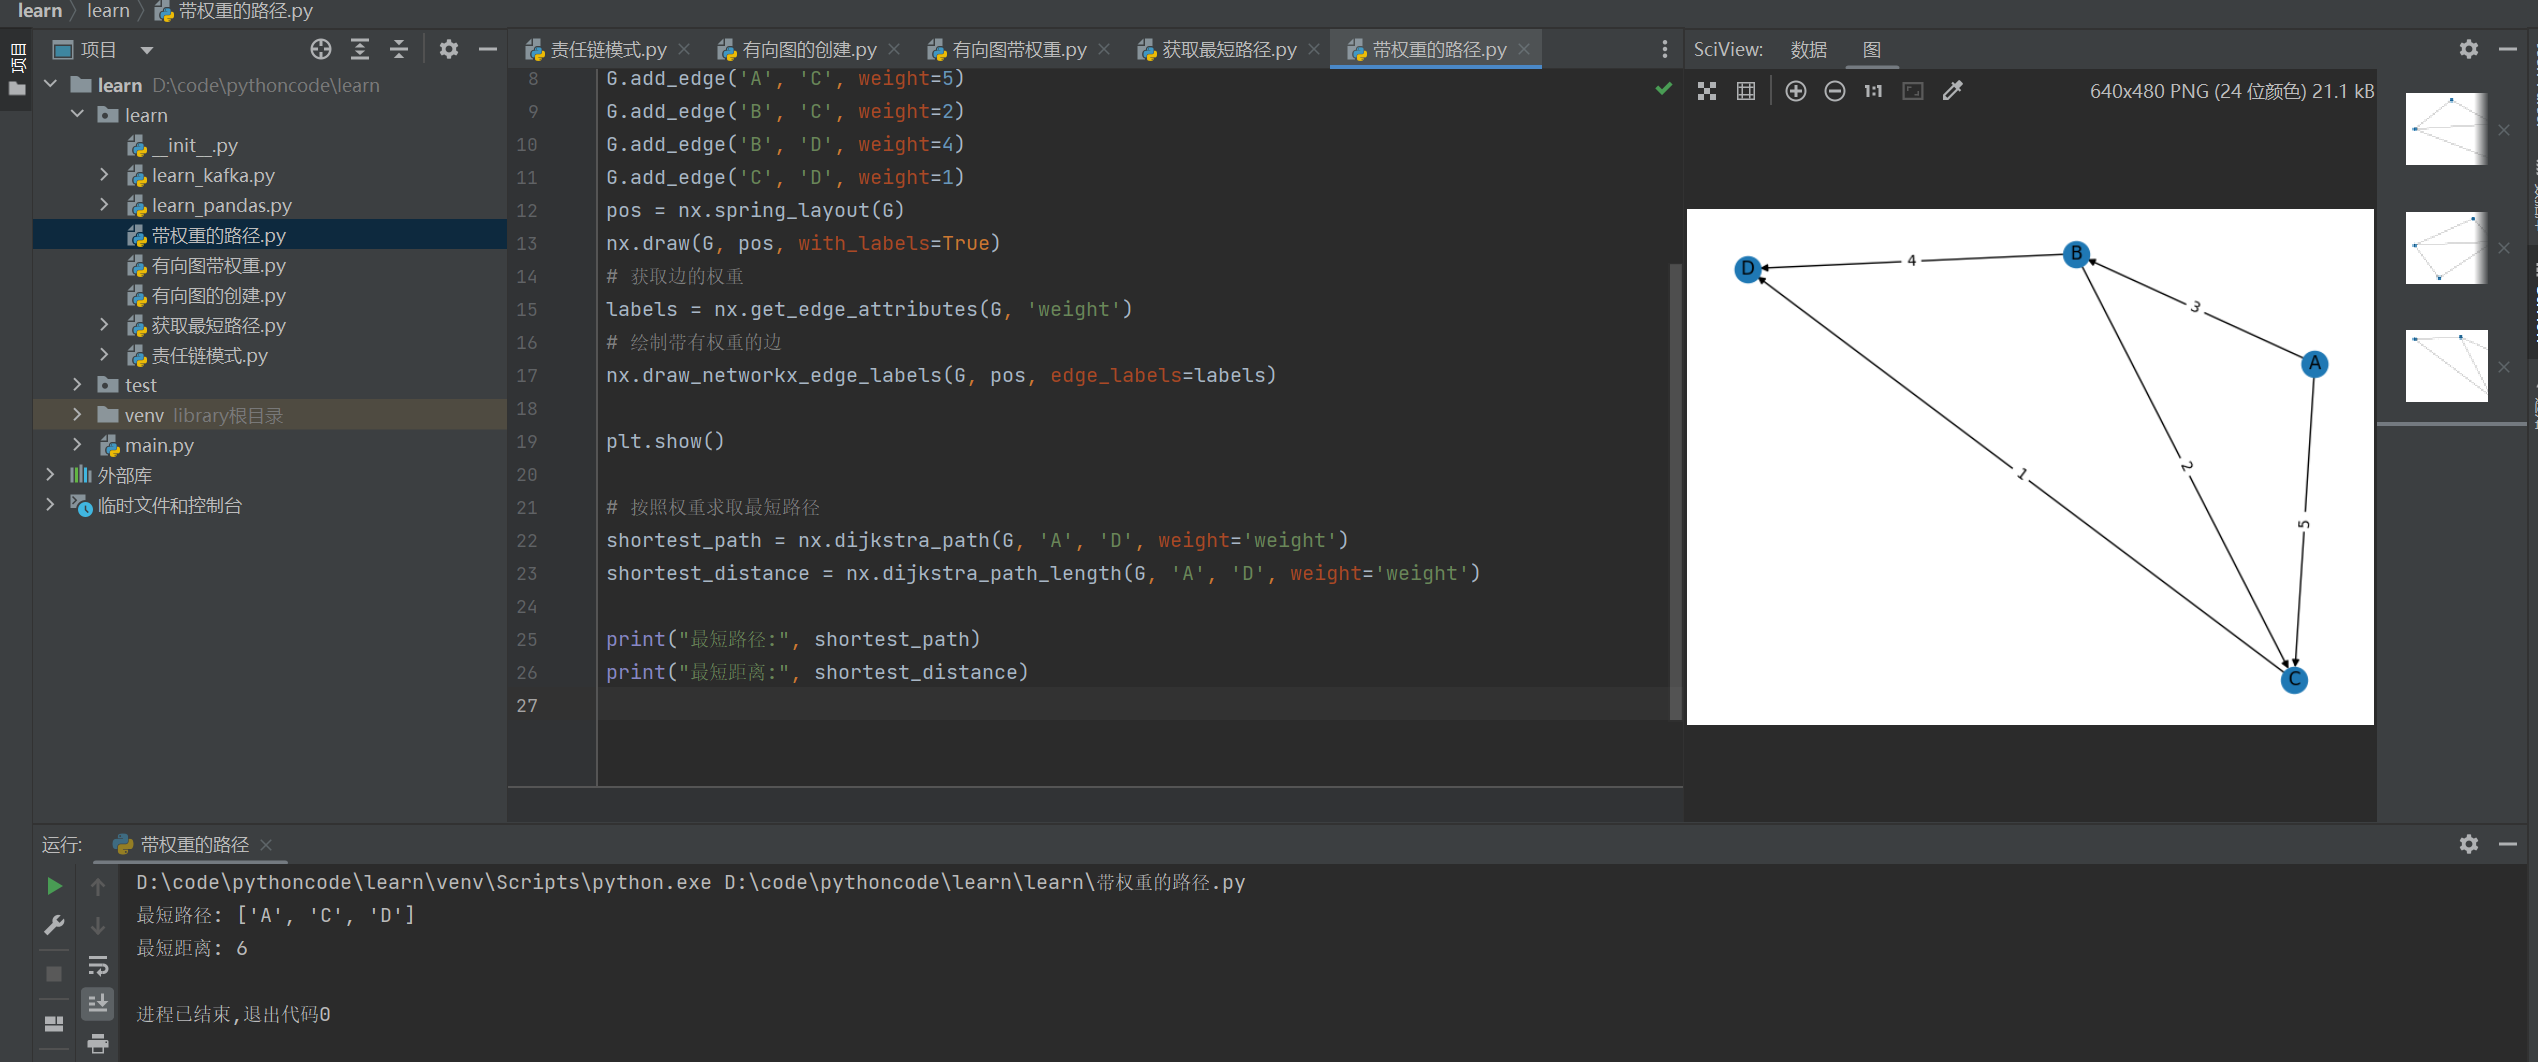
import networkx as nx# 创建有向带权重图G = nx.DiGraph()G.add_edge('A', 'B', weight=3)G.add_edge('A', 'C', weight=5)G.add_edge('B', 'C', weight=2)G.add_edge('B', 'D', weight=4)G.add_edge('C', 'D', weight=1)# 将边的权重取相反数G_neg = nx.DiGraph()for u, v, data in G.edges(data=True): G_neg.add_edge(u, v, weight=-data['weight'])# 按照权重取相反数的图中求取最短路径longest_path = nx.dijkstra_path(G_neg, 'A', 'D', weight='weight')longest_distance = -nx.dijkstra_path_length(G_neg, 'A', 'D', weight='weight')print("最长路径:", longest_path)print("最长距离:", longest_distance)5.json 数据的转换
**说明:**前后端交互的时候通常传回的时候的 json 格式化后的数据,通常需要构建一下,因此最好创建一个统一的类进行封装。
# -*- coding: utf-8 -*-"""图的封装;"""import networkx as nximport matplotlib.pyplot as pltclass GraphDict(object): """有向图的构造; """ def __init__(self): """初始化的封装; """ self.graph = None # 有向图的构建 self.graph_weight = None # 有向图带权重 def dict_to_graph(self, data: list): """ 图的字典模式; :param data: :return: example: data=[{ source: 'Node 1', target: 'Node 3' }, { source: 'Node 2', target: 'Node 3' }, { source: 'Node 2', target: 'Node 4' }, { source: 'Node 1', target: 'Node 4' }] """ graph = nx.DiGraph() # 创建有向图 # 循环添加边, 直接添加上节点 for item in data: graph.add_edge(item.get('source'), item.get("target")) # 赋值并返回 self.graph = graph return graph def dict_to_graph_weight(self, data: list): """ 图的字典模式, 带权重; :param data: :return: example: data = [ { source: 'Node 1', target: 'Node 3', weight: 5 }, { source: 'Node 2', target: 'Node 3', weight: 3, }, { source: 'Node 2', target: 'Node 4', weight: 5, }, { source: 'Node 1', target: 'Node 4', weight: 5 } ] """ graph = nx.DiGraph() # 创建有向图 # 循环添加边, 直接添加上节点, 并且为边赋值上权重; for item in data: graph.add_edge(item.get('source'), item.get("target"), weight=item.get("weight")) # 赋值并返回 self.graph_weight = graph return graph def graph_to_dict(self): """ 图的数据转换成为字典的数据; :return: """ assert self.graph is not None or self.graph_weight is not None, "必须首先通过该类创建一个有向图" if self.graph is None: edges = self.graph_weight.edges(data=True) return [{"source": s, "target": t, "weight": w['weight']} for s, t, w in edges] else: edges = self.graph.edges() return [{"source": s, "target": t} for s, t in edges] def show(self): """ 有向图的显示; :return: """ assert self.graph is not None or self.graph_weight is not None, "必须首先通过该类创建一个有向图" if self.graph is None: pos = nx.spring_layout(self.graph_weight) nx.draw(self.graph_weight, pos, with_labels=True) labels = nx.get_edge_attributes(self.graph_weight, 'weight') nx.draw_networkx_edge_labels(self.graph_weight, pos, edge_labels=labels) plt.show() else: pos = nx.spring_layout(self.graph) nx.draw(self.graph, pos, with_labels=True) plt.show() def to_png(self, name: str): """ 导出有向图的 png 图片; :param name; str, 想要导出 png 图片的名称; :return: """ assert self.graph is not None or self.graph_weight is not None, "必须首先通过该类创建一个有向图" if self.graph is None: pos = nx.spring_layout(self.graph_weight) nx.draw(self.graph_weight, pos, with_labels=True) labels = nx.get_edge_attributes(self.graph_weight, 'weight') nx.draw_networkx_edge_labels(self.graph_weight, pos, edge_labels=labels) plt.savefig(name) else: pos = nx.spring_layout(self.graph) nx.draw(self.graph, pos, with_labels=True) plt.savefig(name)if __name__ == '__main__': graph = GraphDict() data = [ { "source": 'Node 1', "target": 'Node 3' }, { "source": 'Node 2', "target": 'Node 3' }, { "source": 'Node 2', "target": 'Node 4' }, { "source": 'Node 1', "target": 'Node 4' }] data_weight = [ { "source": 'Node 1', "target": 'Node 3', "weight": 3 }, { "source": 'Node 2', "target": 'Node 3', "weight": 3 }, { "source": 'Node 2', "target": 'Node 4', "weight": 3 }, { "source": 'Node 1', "target": 'Node 4', "weight": 3 }] # graph.dict_to_graph(data) # graph.to_png("有向图的导出") graph.dict_to_graph_weight(data_weight) graph.to_png("权重") v = graph.graph_to_dict() print(v)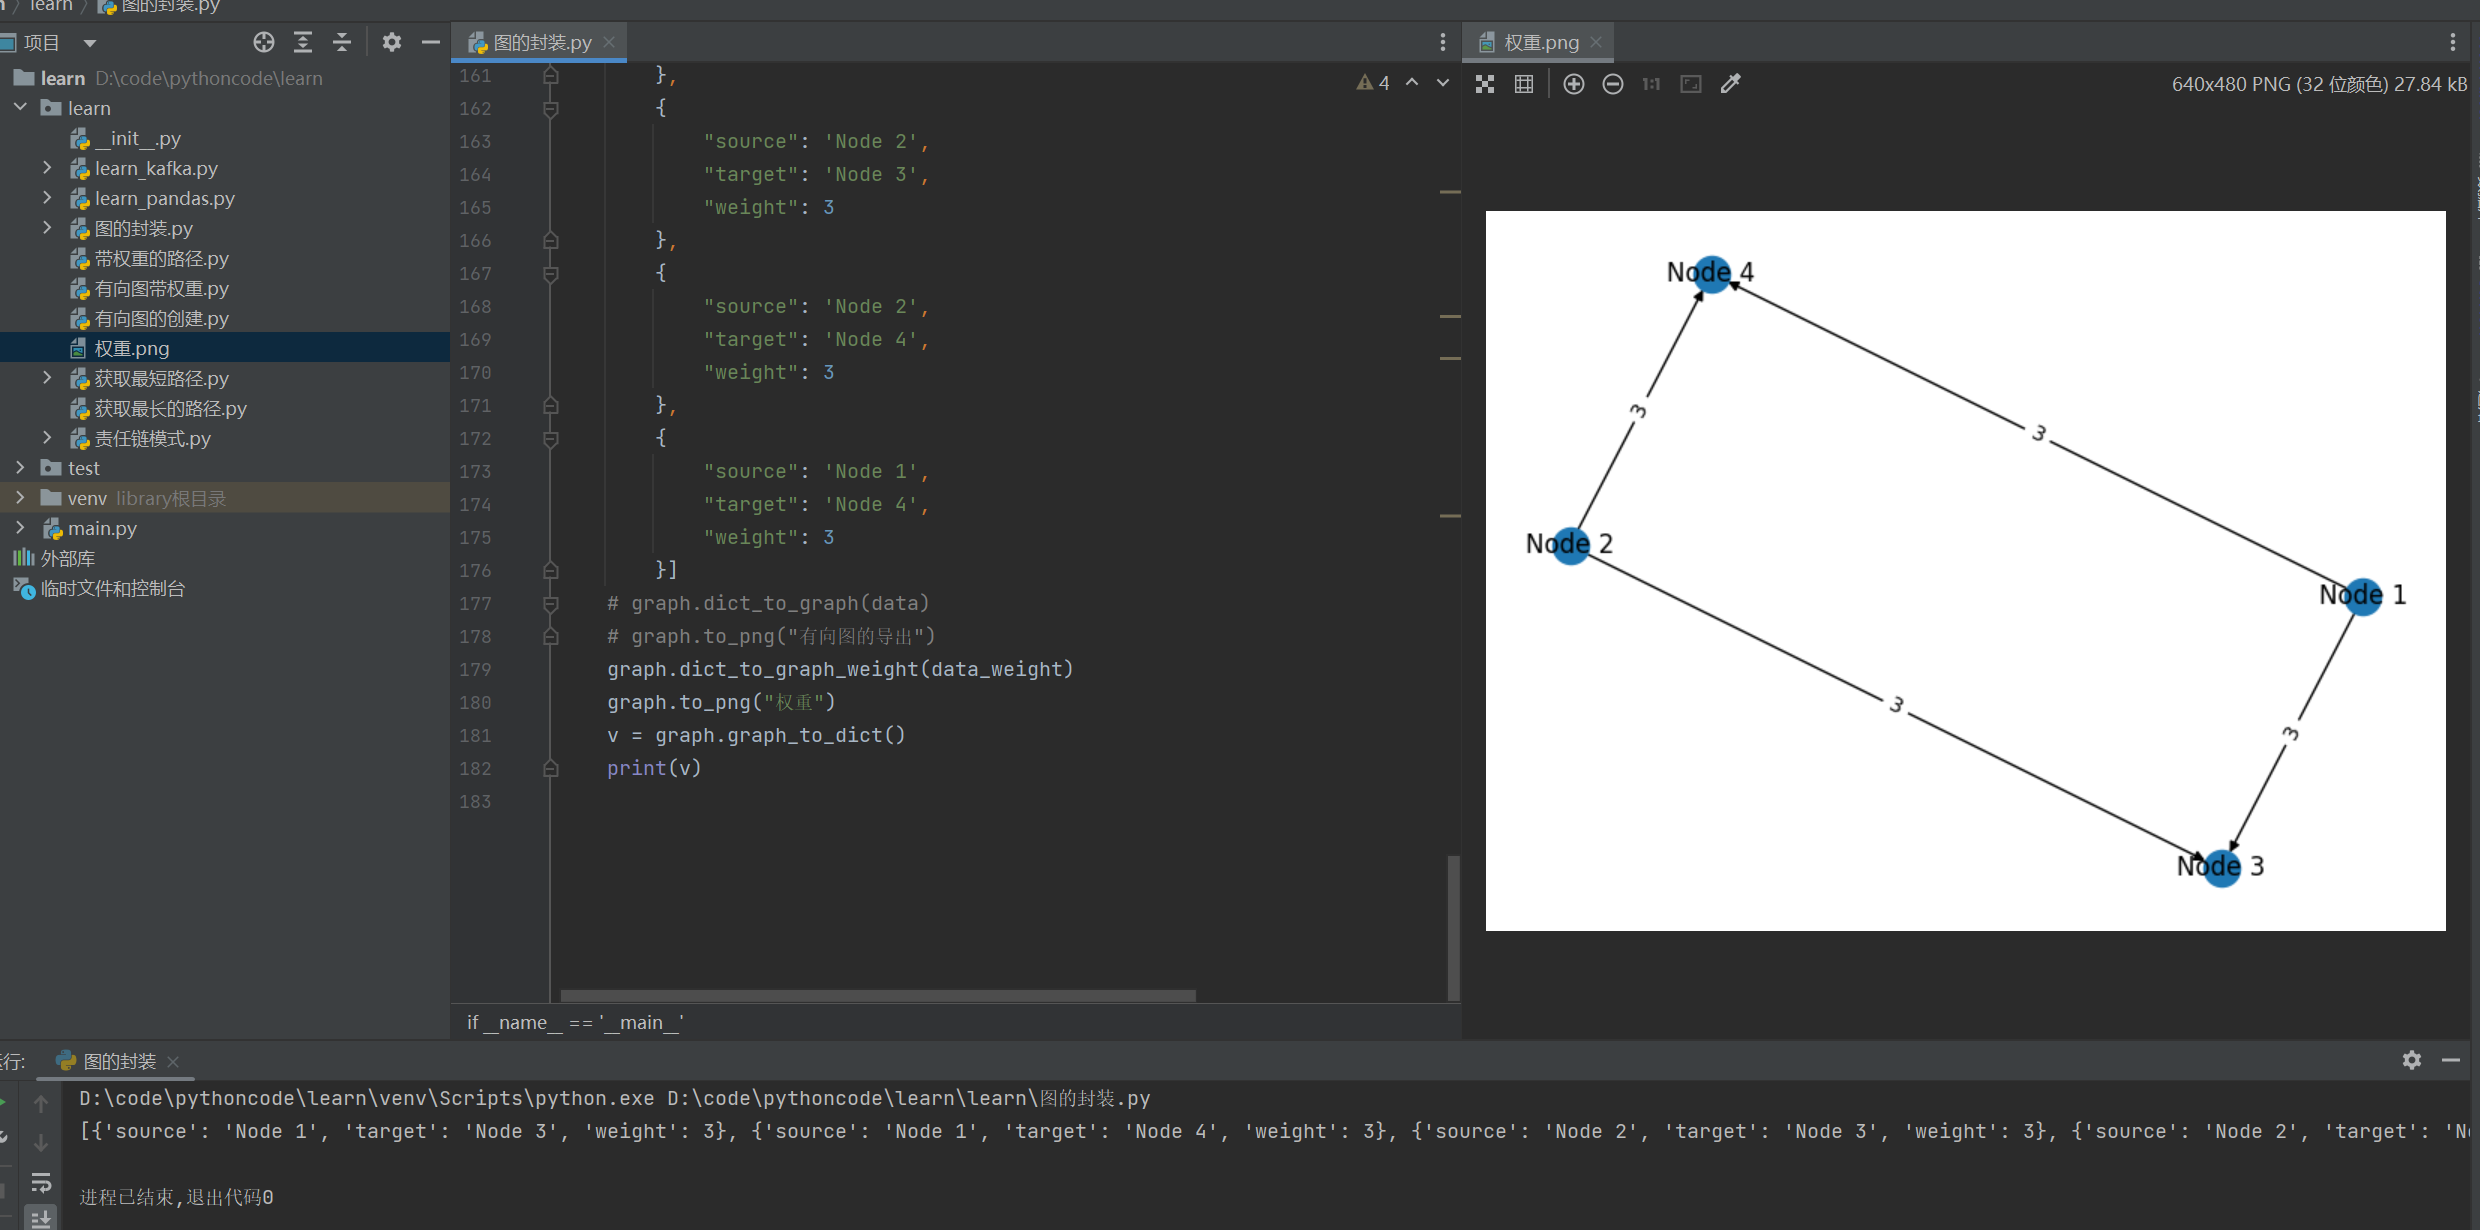
继续努力,终成大器;
来源地址:https://blog.csdn.net/m0_61970162/article/details/131498998


